Form 2 Infographic Dashboard | |
|---|---|
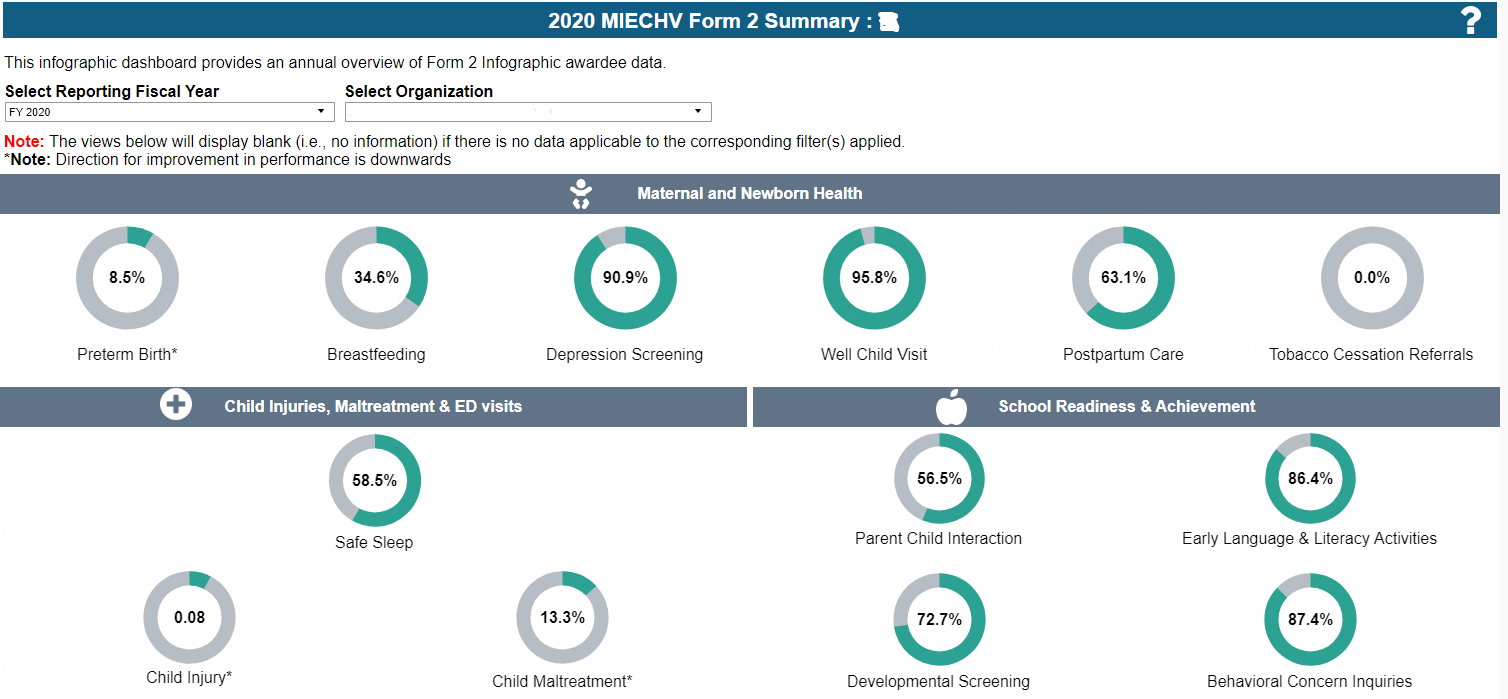
The Form 2 Infographic dashboard provides an annual summary overview of MIECHV awardee data on Performance and Systems Outcome measures. The dashboard represents the data in the following categories:
Filters: The dashboard includes a single select filter for Reporting Fiscal Year. Visualizations can be filtered for different years starting from FY 2017. The organization’s filter will be limited to the awardee’s own organization data. Visualizations in this dashboard: Data for 19 performance measures is displayed using donut charts. A donut chart with asterisks represents performance measures where the direction for improvement in performance is downwards. On hovering over the charts, the corresponding values for the visualizations are shown in the tooltips. | |
Form 2 Infographic Dashboard Visualizations | |
Maternal and Newborn Health: The data is represented in donut charts. The values are shown in percentage form for the following performance measures:
| |
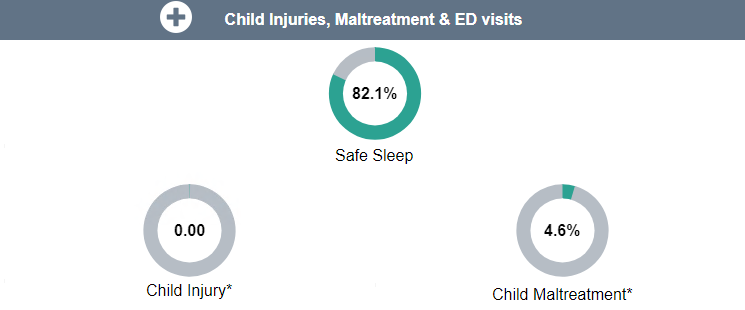
Child Injuries, Maltreatment & ED visits: The data is represented in donut charts. The values are shown in percentage form for the following performance measures:
*Child Injury is represented as a rate not a percentage | |
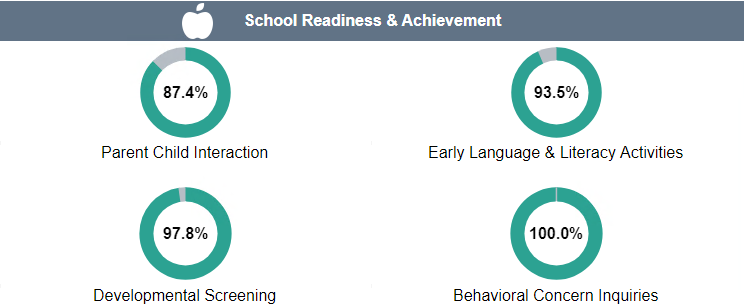
School Readiness & Achievement: The data is represented in donut charts. The values are shown in percentage form for the following performance measures:
| |
Crime or Domestic Violence: The data is represented in donut charts. The values are shown in percentage form for the following performance measure:
| |
Family Economic Self-Sufficiency: The data is represented in donut charts. The values are shown in percentage form for the following performance measures:
| |
Coordination and Referrals: The data is represented in donut charts. The values are shown in percentage form for the following performance measures:
| |
Accessing the Dashboard in the EHBs | ||
|---|---|---|
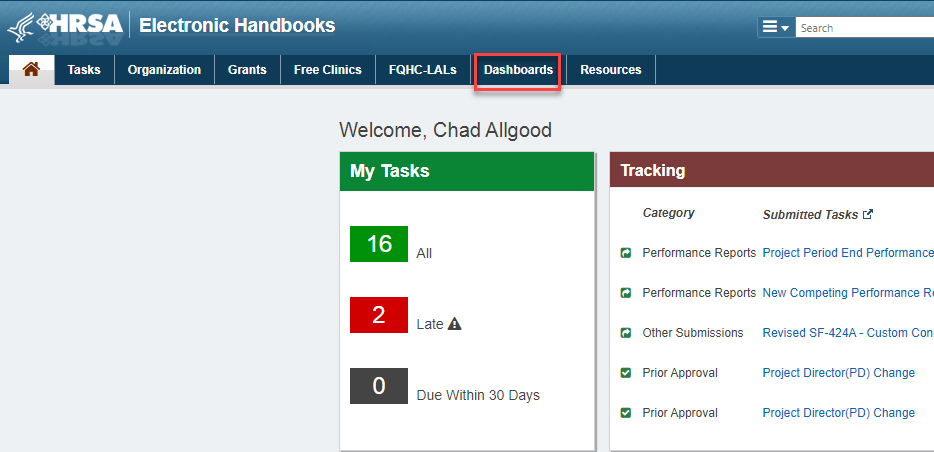
| 1 | Login to the EHBs (https://grants.hrsa.gov) using Login.gov and two-factor authentication. For information about logging into the EHBs and Login.gov, refer to the EHBs Login Process help pages. You will land on the EHBs Home page. Click Dashboards on the Top Menu. | |
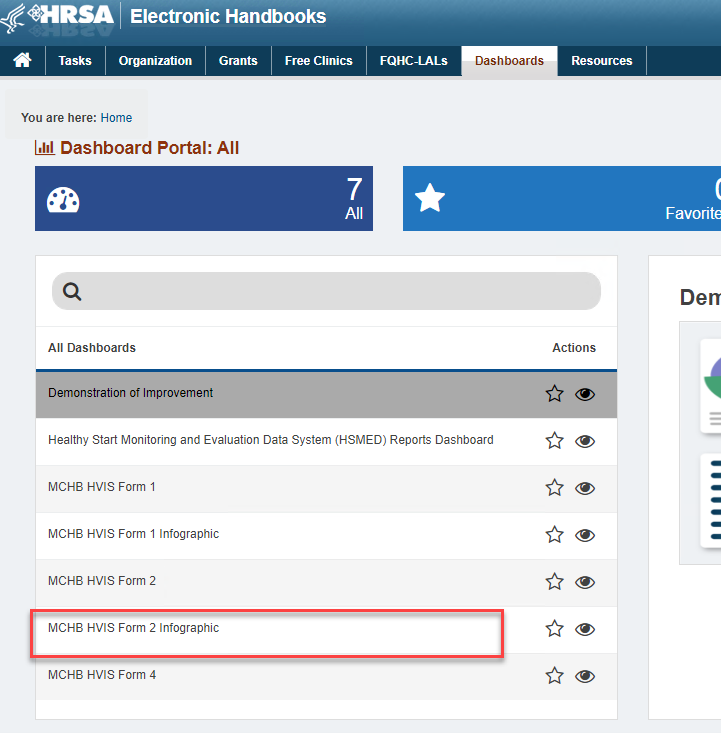
| 2 | You will land on the Dashboards list page, listing all the available dashboards. Select MCHB (HVIS) Form 2 Infographic Dashboard from the list page. | |
| 3 | Click on the View Dashboard or the Eye icon link to open the dashboard. | |
Download |
|---|
The tables and visuals on the dashboard can be downloaded in the following formats: image, crosstab, data, PDF, and PowerPoint. By default, when there are no views selected, the dashboard will not display the download options for data and crosstab formats. Click once on the respective visual/table that needs to be downloaded and the options to download in data and crosstab format are activated. |
