Dashboards |
|---|
Performance Dashboard |
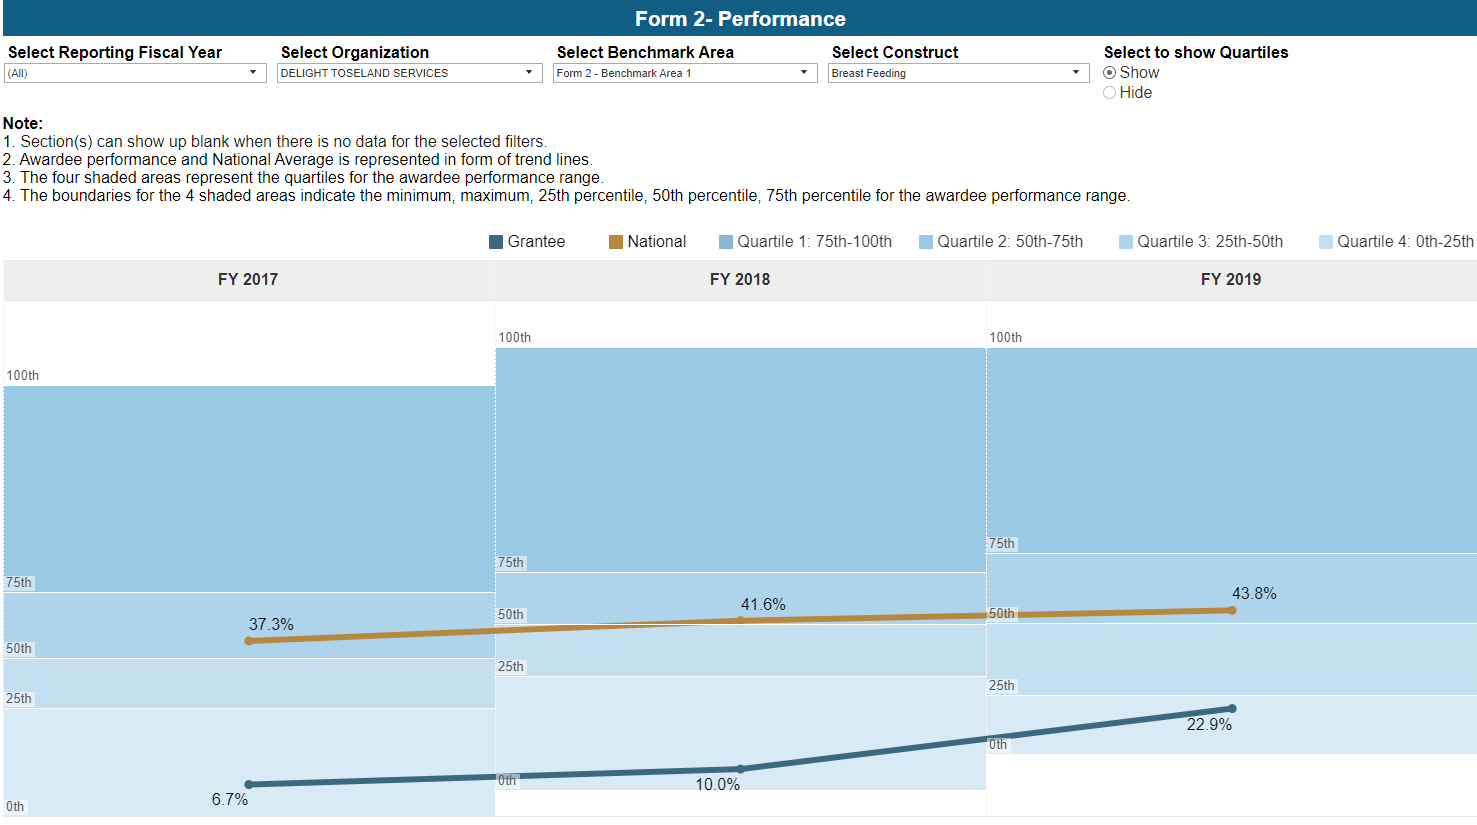
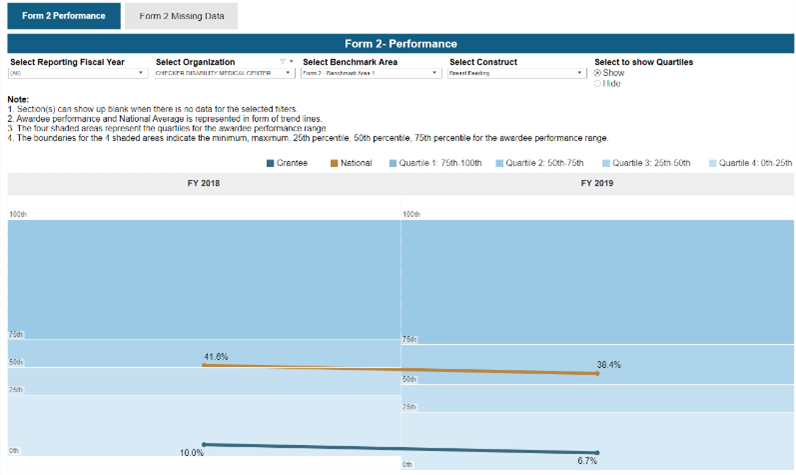
Form 2 Performance The Form 2 Performance dashboard provides awardee-level and national comparison data on MIECHV performance indicators and system outcome measures. The visuals display data for all 19 MIECHV performance measures across the six benchmark areas, for six benchmark areas and six constructs for fiscal years starting from 2017. The visualization for each fiscal year is divided into 4 sections: one for each quartile. A radio button option to show/hide the quartiles can be selected to display the quartile data points (4 shaded areas) of the respective fiscal years. The blue trend line indicates the performance of the grantee for that fiscal year. The gold trend line indicates the National performance for that fiscal year. This visualization can be filtered by the reporting fiscal year, benchmark area and construct. Hovering over the blue trend line (for the awardee performance), the tooltip displays the reporting fiscal year, benchmark area, construct, and grantee performance in percentage. Hovering over the blue trend line (for the grantee performance), the tooltip displays the reporting fiscal year, benchmark area, construct, and national performance in percentage. |
Missing Data Dashboard |
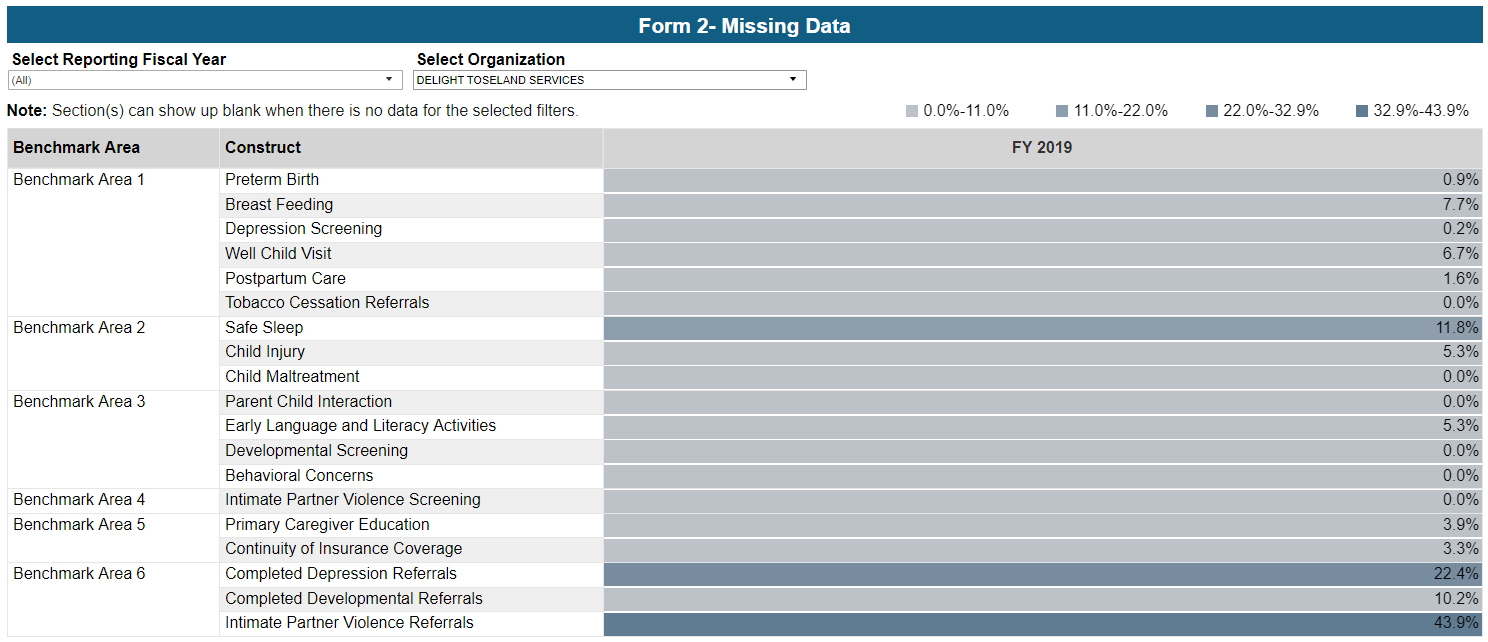
Form 2 Missing Data This visualization provides awardee-level missing data reported for each of the Form 2 measures. Data is considered missing if one or more data elements needed to determine inclusion in the numerator or denominator are unknown. All cases of missing data are excluded from the measure calculations provided in the Form 2 Performance dashboards. The percentage of missing data is divided in 4 quartile sections as denoted in the legends. This visualization can be filtered by the reporting fiscal year. When hovering over the cells of each fiscal year, the tooltip displays the reporting fiscal year, benchmark area, construct, and the percentage of missing data. |
Accessing HVIS Form 2 Dashboards | |
|---|---|
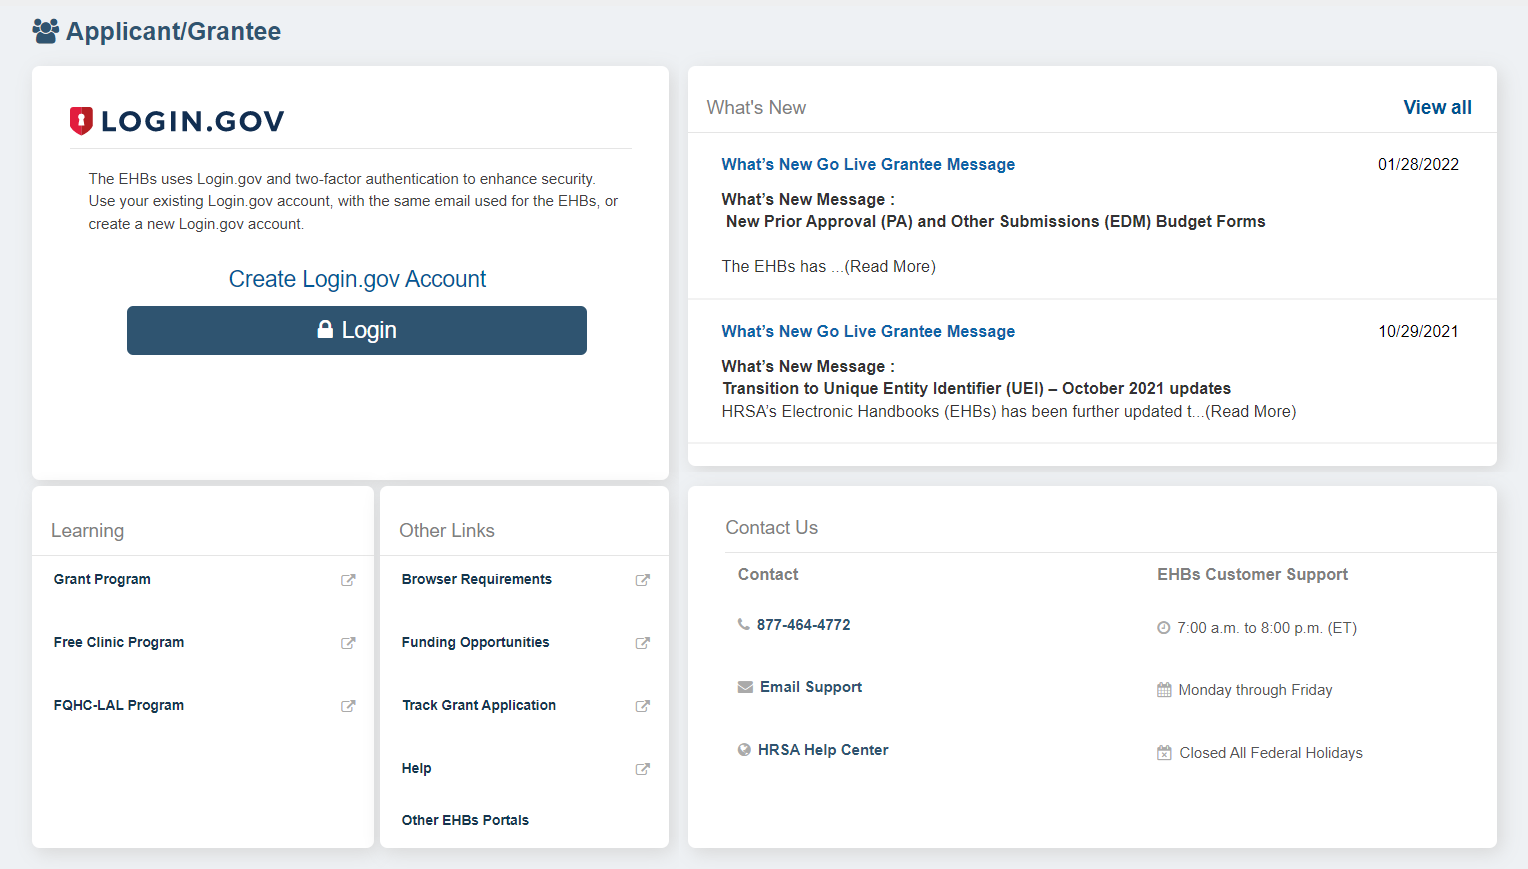
Login to HRSA Grants EHBs. https://grants.hrsa.gov/2010/WebEPSExternal/Interface/Common/AccessControl/Login.aspx For information about logging into the EHBs and Login.gov, refer to the EHBs Login Process help pages. | |
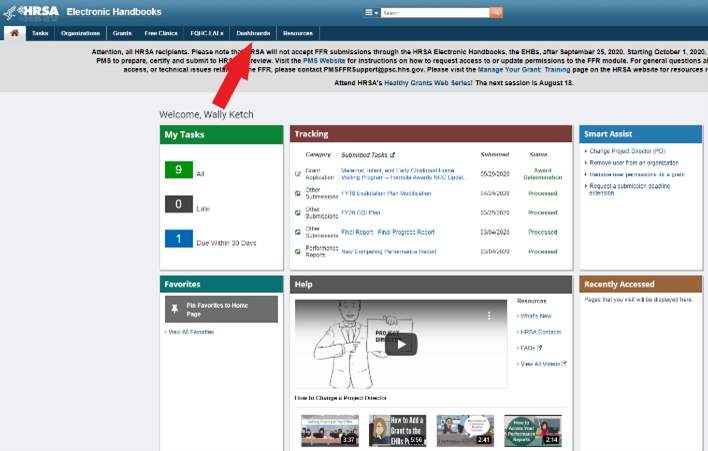
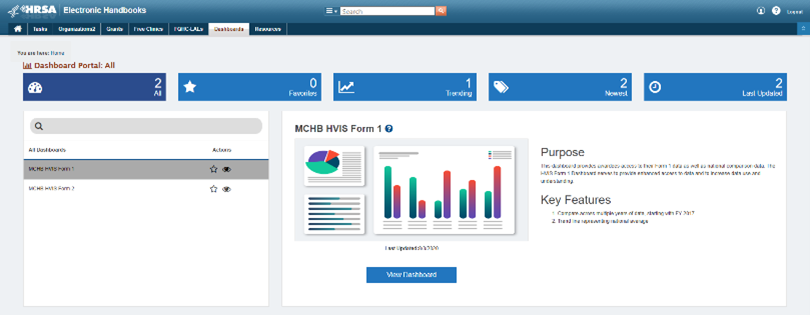
| You will land on the EHBs External Dashboards Home page. Click on Dashboards on the top menu. | |
The Dashboards list page shows all the available dashboards for your role. Click on View Dashboard for the MCHB HVIS Form 2 dashboard. | |
You will land on the MCHB HVIS Form 2 dashboard. | |
