Impact of the Ryan White HIV/AIDS Program | |
|---|---|
| This screen displays client outcome data for viral suppression and retention in care. You can view national, state, metropolitan area, recipient, and provider data. | |
Impact of the Ryan White HIV/AIDS Program Charts | |
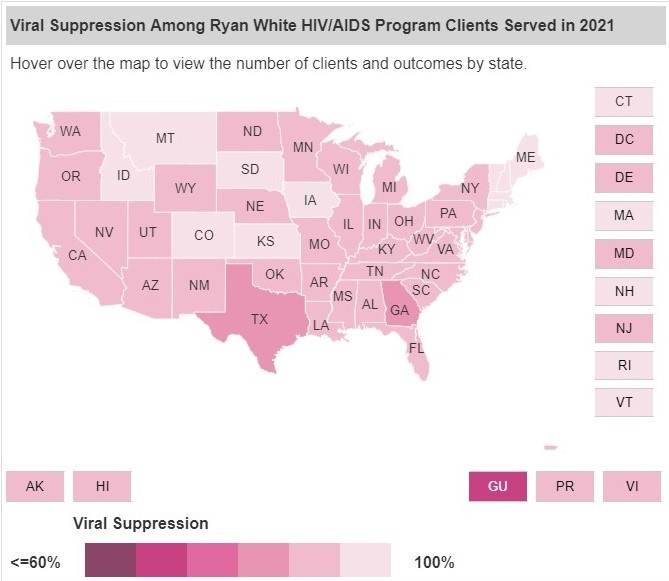
| Chart 1: Outcome Measure Map This map provides state-level information about the selected outcome measure. Darker colors represent lower viral suppression rates, and lighter colors represent higher viral suppression rates. | |
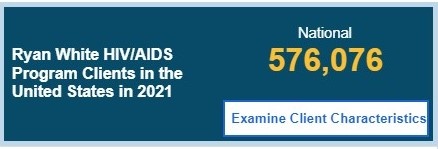
| Chart 2: RWHAP Program Clients Summary This presents the number of RWHAP clients served in the selected location. | |
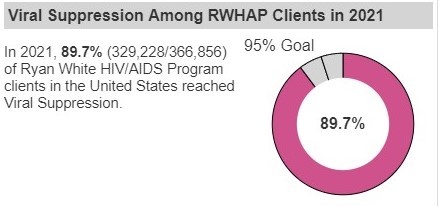
Chart 3: Outcome Measure Summary The outcome measures indicate the number of clients who meet the selected outcome criteria compared to the total number of clients who meet the denominator inclusion criteria. When looking at state or metropolitan area data, national data is provided for comparison. Percentages for these data are also displayed. The donut chart shows the percentage of clients meeting the outcome measure compared to the national goals for the selected outcome measure. | |
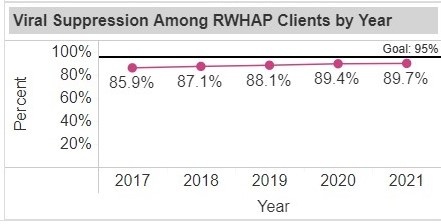
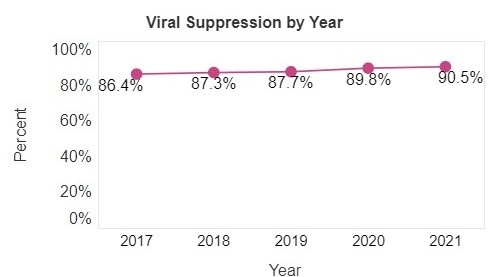
Chart 4: Outcome Measure among RWHAP Clients by Year This graph shows the percentage of clients who meet the outcome measure over a five-year period. The goal for this outcome measure is also provided on the graph. | |
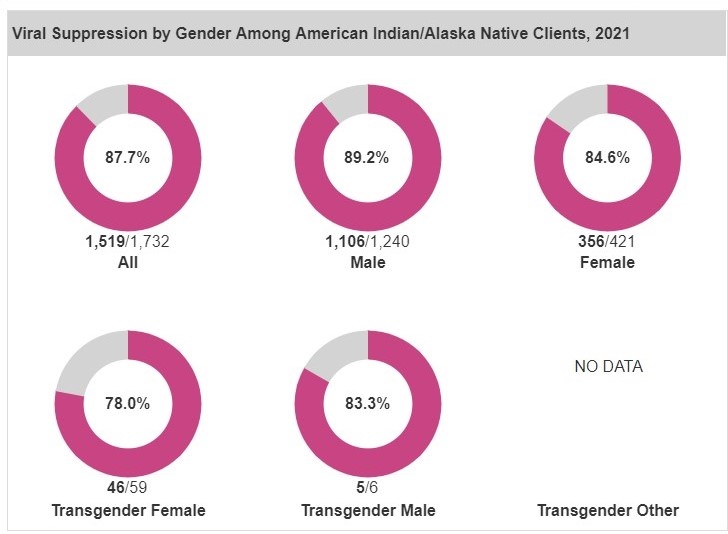
Chart 5: Outcome Measure among Priority Populations The donut charts show the selected outcome measure for several priority populations. This percentage is derived from the total number of clients who achieved the specified outcome and the total number of clients within the priority population who meet the denominator inclusion criteria. | |
Characteristics of Ryan White HIV/AIDS Program Clients | |
| This screen displays characteristics and demographics of the clients served by RWHAP. | |
Characteristics of Ryan White HIV/AIDS Program Clients Charts | |
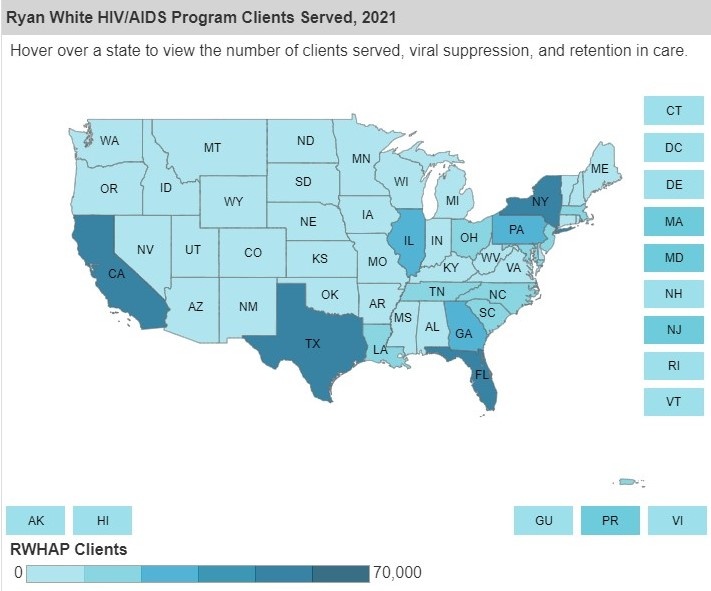
Chart 1: RWHAP Clients Served Map This map shows national or state-level information about RWHAP clients for the selected year. | |
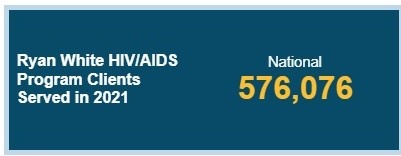
Chart 2: RWHAP Program Clients Summary This presents the number of RWHAP clients served in the selected location. | |
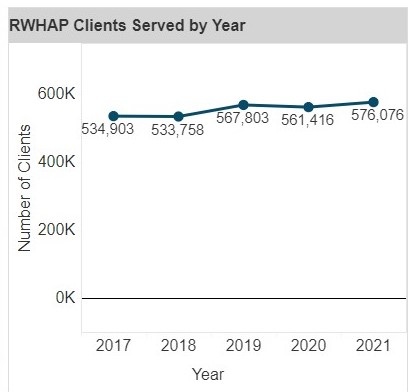
Chart 3: RWHAP Clients Served by Year This graph shows the number of clients served in the selected location over a five-year period. | |
Chart 4: RWHAP Clients by Race/Ethnicity This bar chart shows the percentage of clients in each race/ethnicity category. Racial/ethnic minorities are indicated by yellow bars, and the total percentage of clients that are racial/ethnic minorities is displayed below the bar chart. | |
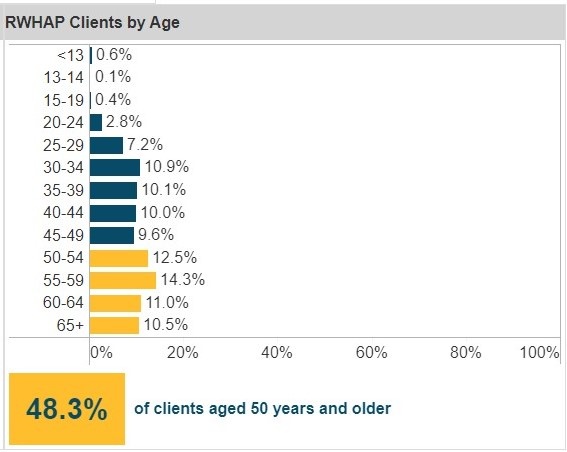
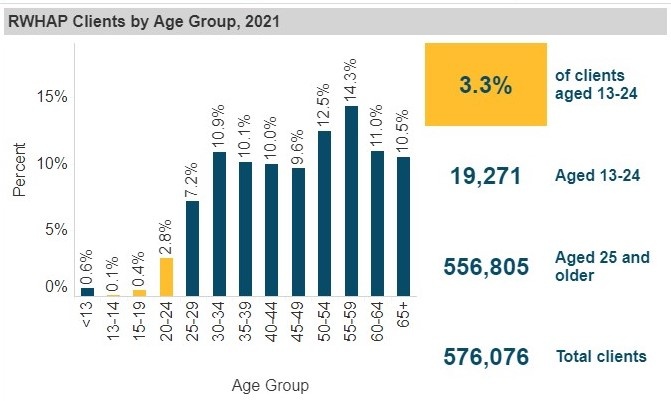
Chart 5: RWHAP Clients by Age This bar chart shows the percentage of clients in each age group. Age groups within the aged 50 years and older category are indicated by yellow bars, and the total percentage of clients that are aged 50 years and older is displayed below the bar chart. | |
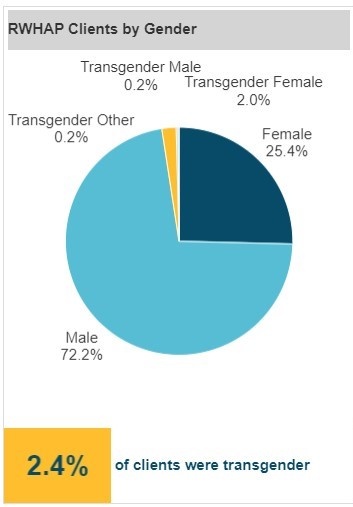
Chart 6: RWHAP Clients by Gender This pie chart shows the distribution of client gender. Transgender clients are represented by the yellow slice. The total percentage of transgender clients is displayed below the pie chart. | |
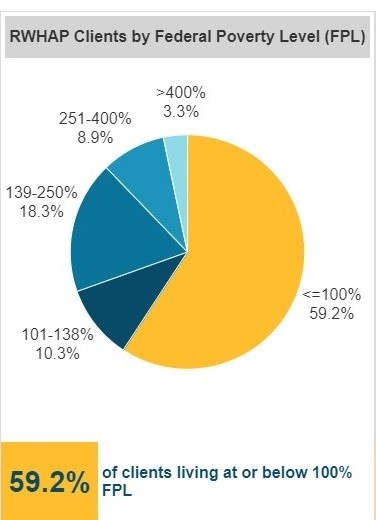
Chart 7: RWHAP Clients by Federal Poverty Level This pie chart shows the distribution of income level as a percent of Federal Poverty Level (FPL). Clients living at or below 100% FPL are represented in yellow. The total percentage of clients at or below 100% FPL is displayed below the pie chart. | |
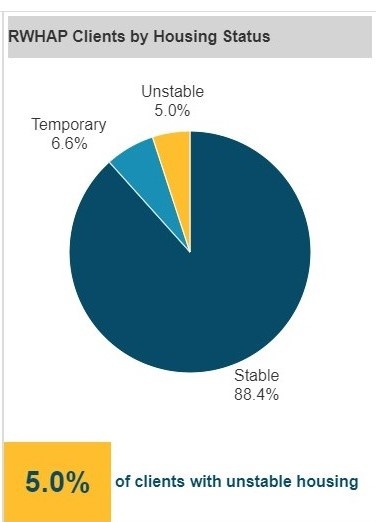
Chart 8: RWHAP Clients by Housing Status This pie chart shows the percent distribution of housing status for RWHAP clients. Clients with unstable housing are represented in yellow. The total percentage of clients with unstable housing is displayed below the pie chart. | |
Benchmarking Performance | |
| The Benchmarking Performance screen shows performance data, including observed outcome measures and standardized performance. When the Benchmarking Performance screen first loads, it displays "NO DATA." Select a priority population or "All Clients" from the priority population dropdown menu and a jurisdiction or provider in order to update the view. | |
Benchmarking Performance Charts | |
Chart 1: Observed Outcome Measure by Year This line chart plots the observed viral suppression or retention in care over a five-year period. | |
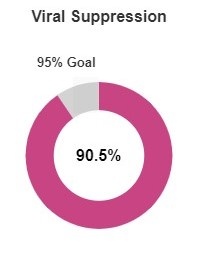
Chart 2: Observed Outcome Measure Summary This donut chart shows the observed viral suppression or retention in care for the selected data year. It also shows the national goal for the selected outcome measure. | |
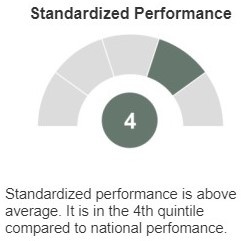
Chart 3: Standardized Performance This gauge shows the standardized performance for the selected outcome measure. A score in the first quintile is in the bottom 20%; a score in the third quintile is in the middle 20%; and a score in the fifth quintile is in the top 20%. | |
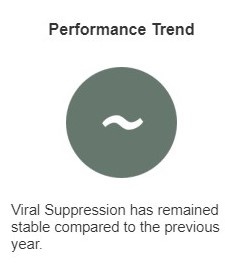
| Chart 4: Performance Trend This icon shows whether the observed rate of the selected outcome measure for the jurisdiction has increased, decreased, or stayed the same as compared to the previous data year. | |
Chart 5: National Goal This icon is a green checkmark if the jurisdiction has met the National HIV/AIDS Strategy (NHAS) indicator for the selected outcome measure based on their observed rate of the selected outcome measure. It is a gray “x,” if the national goal has not yet been met. | |
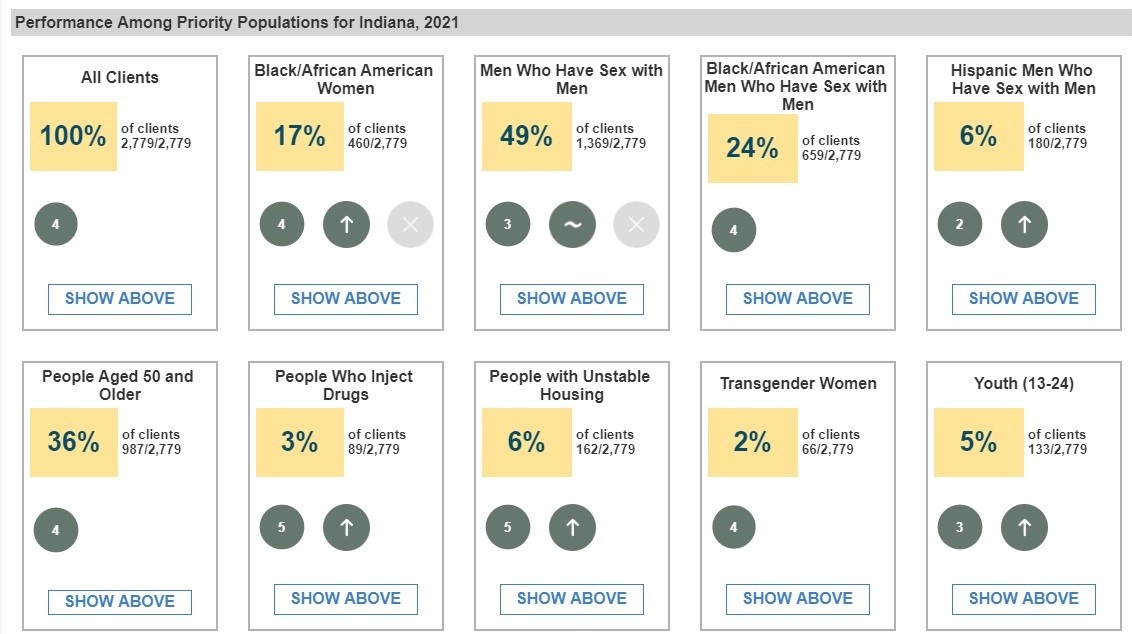
Chart 6: Performance among Priority Populations These figures show performance among specific, priority populations and include the percentage of clients within that population and the standardized performance, trend, and national goal icons. | |
Outcome Measures by Age | |
This screen shows the outcomes and client characteristics by age group, with a focus on youth (aged 13–24 years) and clients aged 50 years and older. When the screen first loads, it displays the most recent national data for clients of all race/ethnicity categories and genders who are aged 13–24 years. Use the dropdowns in the filters panel to customize the data that is presented. | |
Outcome Measures by Age Charts | |
Chart 1: RWHAP Clients by Age Group This bar chart contains a visualization of the defined population by age group. The age groups that fall within the selected age range (aged 13–24 years or aged 50 years and older) will be highlighted in yellow on the bar chart. To the right of the chart is a summary of data related to the selected age range. | |
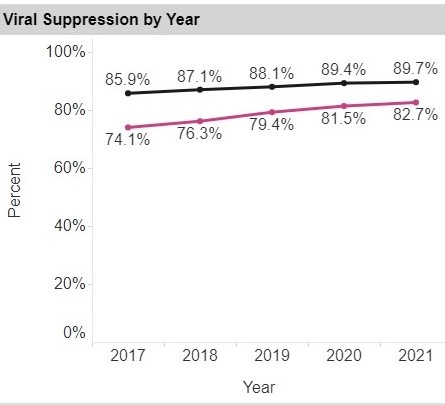
Chart 2: Outcome Measure by Year This trend chart shows the outcome measure for the selected age range (aged 13–24 years or aged 50 and older) versus the national data for all age groups. | |
Chart 3: Outcomes and RWHAP Clients by Age among Priority Populations These small boxes compare viral suppression or retention in care of the selected age range (aged 13–24 years or aged 50 years and older) among various priority populations. They also show what percentage of clients makes up the selected age range and population to provide data regarding the size of each priority population. | |
Outcome Measures by Client's Race/Ethnicity | |
| This screen displays viral suppression or retention in care by client’s race/ethnicity. | |
Outcome Measures by Client's Race/Ethnicity Charts | |
Chart 1: Summary Information This block contains key contextual information for the selected race or ethnicity.
| |
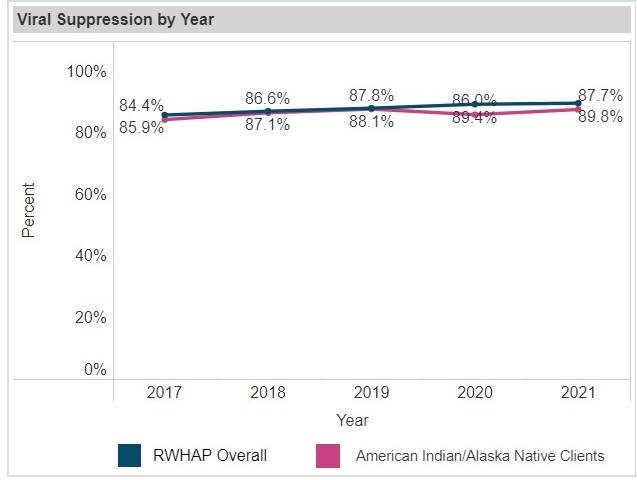
Chart 2: Outcome Measure by Year The magenta trend line shows the selected outcome measure over a five-year period for the selected race/ethnicity category. A trend line for the national data for all race/ethnicity categories is plotted in dark blue for comparison. | |
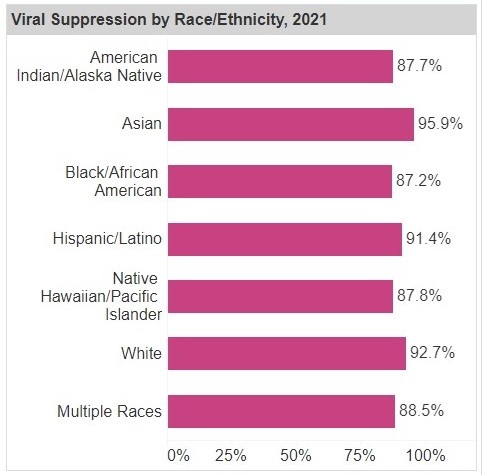
Chart 3: Outcome Measure by Race/Ethnicity This bar chart shows the outcome measure by race/ethnicity categories. | |
Chart 4: Outcome Measure by Gender This bar chart shows the outcome measure by gender for the selected race/ethnicity category. | |
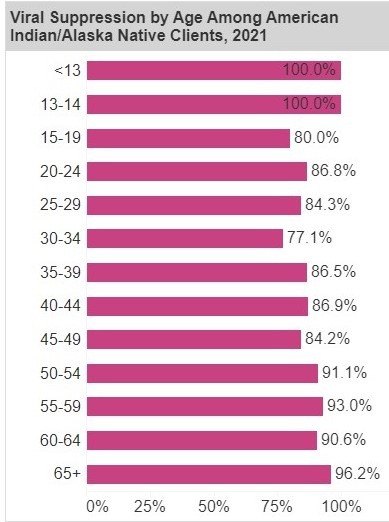
Chart 5: Outcome Measure by Age This bar chart shows the outcome measure by age for the selected race/ethnicity category. | |
Outcome Measures by Housing Status | |
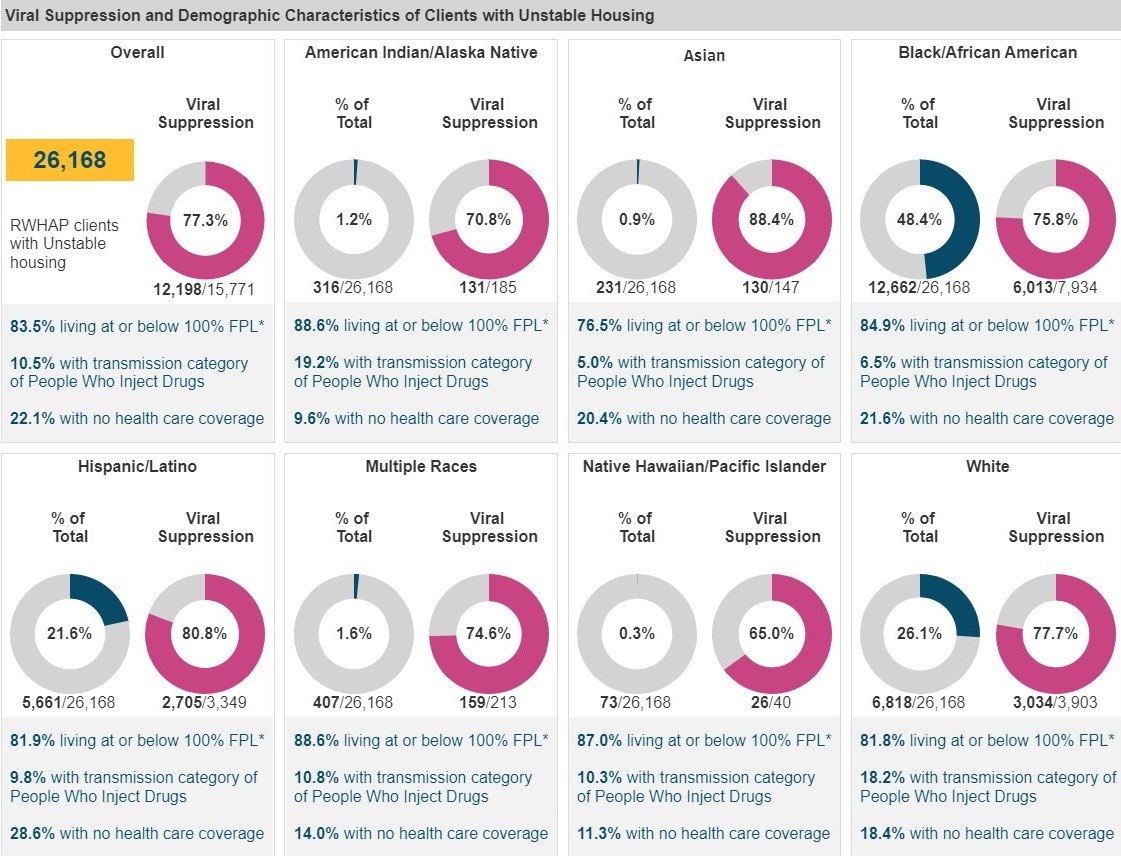
This screen shows viral suppression and retention in care by housing status. It also explores how these outcome measures differ among priority populations. When the screen first loads, it displays the most recent data for viral suppression among those with unstable housing. Select a different housing status from the dropdown menu to change the display. This screen has three tabs that allows the view to be toggled and the charts to be viewed by race/ethnicity, age, or gender. Selecting a tab will update certain figures on the page. | |
Outcome Measures by Housing Status Charts | |
Chart 1: Housing Status Summary This box highlights the percentage of RWHAP clients within the selected population who reported having unstable housing. | |
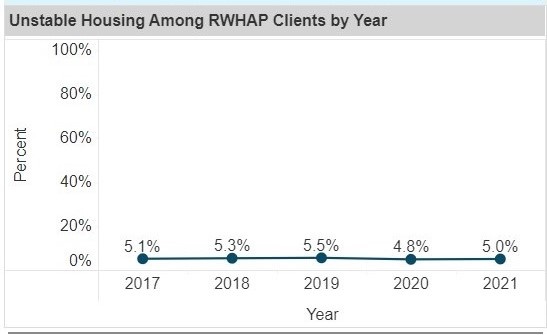
Chart 2: Housing Status among RWHAP Clients by Year This chart shows the percentage of clients within the defined population who reported having the selected housing status over a five-year period. | |
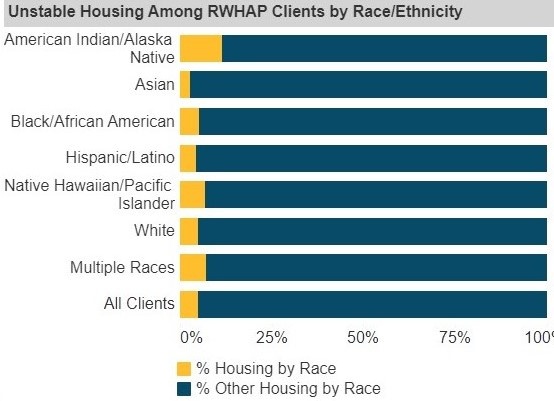
Chart 3: Housing Status among RWHAP Clients by Race/Ethnicity, Age, or Gender | |
Chart 4: Outcome Measure and Demographic Characteristics These small boxes display outcomes and demographic characteristics for clients with the selected housing status. The data in these boxes can be viewed by race/ethnicity, age, or gender by selecting the relevant tab at the top of the screen. | |
Outcome Measures by Transmission Category | |
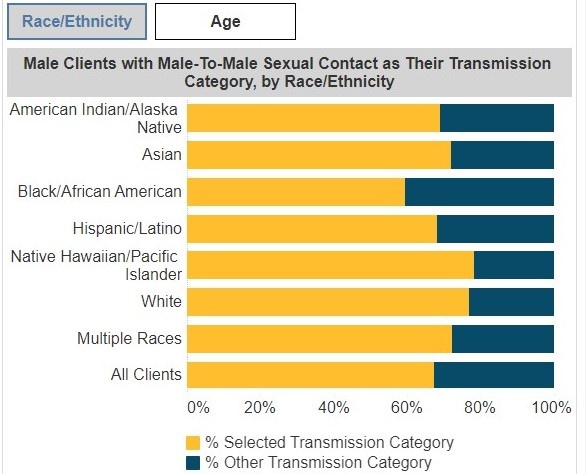
This screen shows viral suppression or retention in care by transmission category, as well as variations among priority populations. When the screen first loads, it displays the most recent data for viral suppression and male-to-male sexual contact. Select a Gender and Transmission Category from the dropdown menus to change the data displayed. The screen will automatically update based on the selections. This screen also has two tabs that allow the views to be filtered by race/ethnicity or by age. Selecting either tab will update some of the figures on the page. | |
Outcome Measures by Transmission Category Charts | |
Chart 1: Transmission Category Summary This box highlights the percentage of clients within the selected population who reported the selected transmission category. | |
Chart 2: RWHAP Clients by Transmission Category by Year This chart shows the percentage of clients within the selected population who reported the selected transmission category over a period of five years. | |
| Chart 3: RWHAP Clients by Race/Ethnicity or Age These yellow bar graphs show the prevalence of the selected transmission category within the selected population. The tabs at the top change the view from race/ethnicity to age. | |
Chart 4: Outcome Measure and Demographic Characteristics by Transmission Category | |
RWHAP Services Received | |
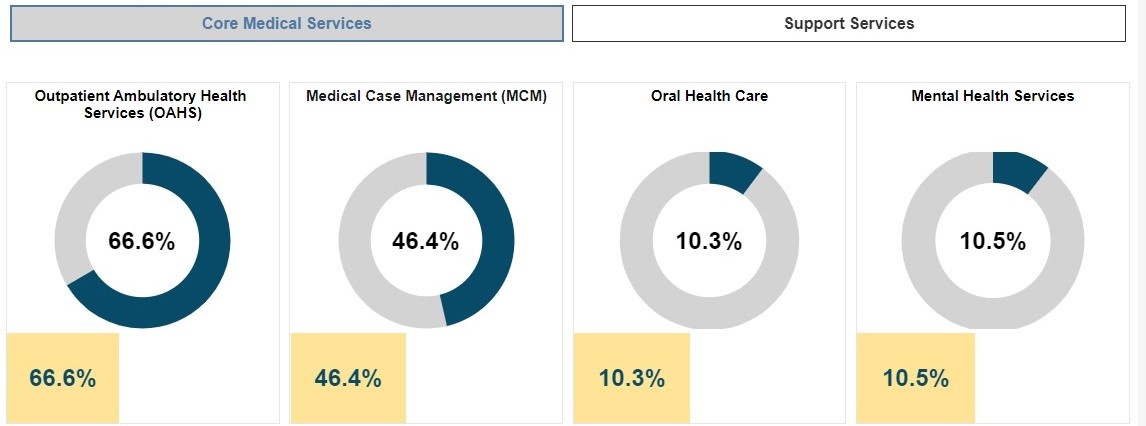
This screen shows the percentage of RWHAP clients receiving core medical and support services. Please refer to Policy Clarification Notice 16-02 for a complete description of the RWHAP service categories. This page also includes two tabs, which allow the view to be toggled between Core Medical Services and Support Services. | |
RWHAP Services Received Charts | |
Chart 1: Services Data These small boxes show the percentage of clients in the selected jurisdiction who received a specific service. Note that RWHAP clients may receive multiple services and that not all services are available in all jurisdictions. | |
AIDS Drug Assistance Program Client Characteristics | |
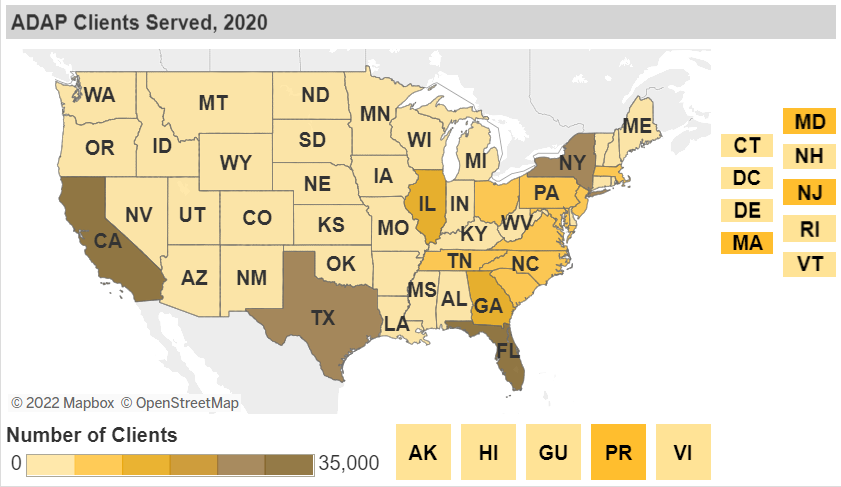
This screen shows demographic characteristics of RWHAP AIDS Drug Assistance Program (ADAP) clients. ADAP is a state- and territory-administered program that provides medications and access to health care coverage to low-income people with HIV who are uninsured or underinsured. The initial view shows the most recent national ADAP data. Select a jurisdiction and a service category from the dropdown menus to change the data displayed. | |
AIDS Drug Assistance Program Client Characteristics Charts | |
Chart 1: ADAP Clients Served Map This map shows the national or state-level information about ADAP clients for the selected year. | |
| Chart 2: ADAP Program Clients This chart shows the number of ADAP clients for the selected location. | |
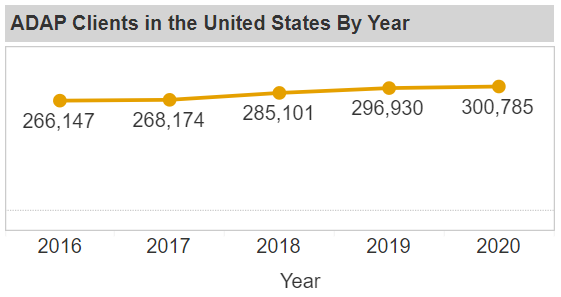
| Chart 3: ADAP Clients Served by Year This graph shows the number of clients for the selected location over a five-year period. | |
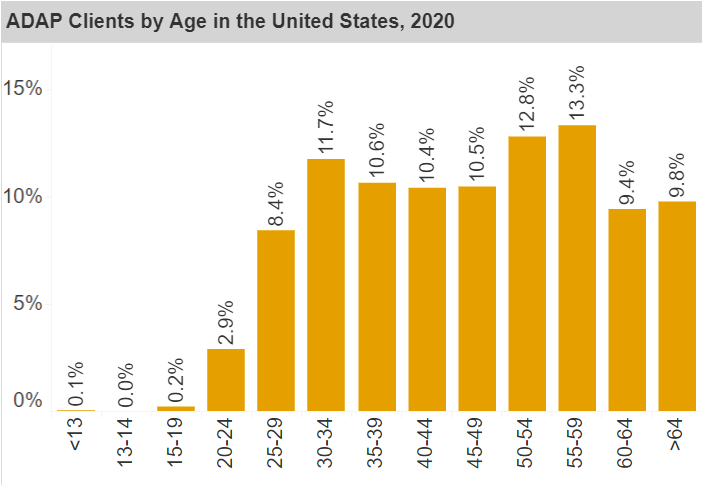
| Chart 4: ADAP Clients by Age This bar chart shows the percentage of clients in each age group. | |
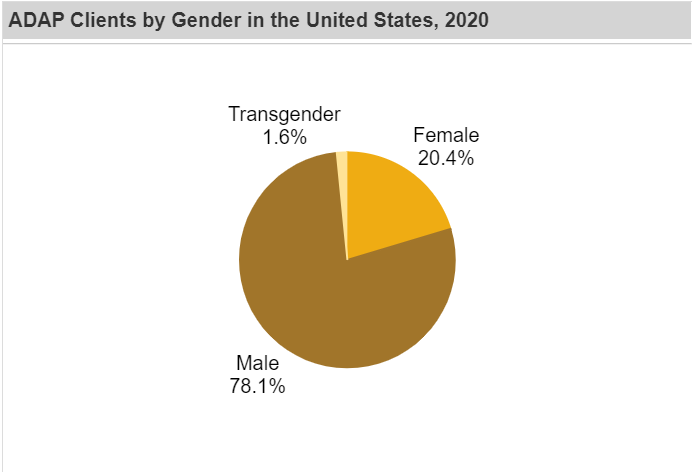
| Chart 5: ADAP Clients by Gender This pie chart shows the distribution of client gender. | |
| Chart 6: ADAP Clients by Gender This pie chart shows the distribution of client gender. | |
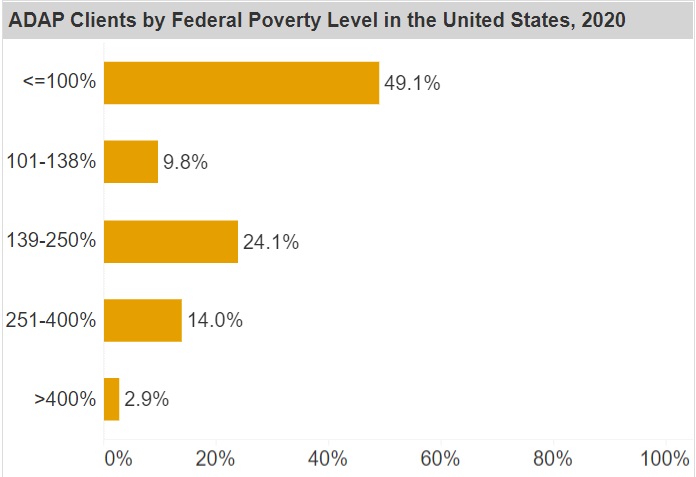
| Chart 7: ADAP Clients by Federal Poverty Level This pie chart shows the percent distribution of income level as a percent of FPL. | |
Recipient and Provider Characteristics | |
| This screen shows detailed data for recipients and providers. | |
Recipient and Provider Characteristics Charts | |
Chart 1: Provider Map This map plots the providers associated with a recipient. Hovering over a point on the map displays details about the provider, including provider name, total clients, viral suppression, and retention in care. | |
| Chart 2: Provider List This table shows the providers associated with a recipient. It includes provider name, number of clients, observed viral suppression, viral suppression standardized performance, observed retention in care, and retention in care standardized performance. | |
Technical Notes and Definitions | |
Age Group RWHAP grant recipients and subrecipients report client birth year, which is used to calculate the client's age during the designated year as a discrete variable. On the RWHAP Compass Dashboard, younger and older clients are sometimes highlighted as priority populations: Youth (aged 13–24) and Aged 50 years and older. Eligible Metropolitan Areas (EMAs) and Transitional Grant Areas (TGAs) RWHAP Part A provides emergency assistance to EMAs and TGAs that are most severely affected by the HIV epidemic. To qualify for EMA status, an area must have reported at least 2,000 AIDS cases in the most recent 5 years and have a population of at least 50,000. To be eligible for TGA status, an area must have reported 1,000–1,999 AIDS cases in the most recent 5 years and have a population of at least 50,000. EMAs and TGAs range in size from one city or county to more than 26 different geographic entities; 11 include parts of more than one state. The boundaries of EMAs and TGAs are based on the U.S. Census Bureau delineation of the Metropolitan Statistical Area at the time of first eligibility. Client-level data are reported based on provider location,rather than client location. It is important to note that data shown for EMAs and TGAs are not mutually exclusive; clients may have received services from providers in multiple EMAs and TGAs. In addition, data presented for EMAs and TGAs are not limited to entities receiving RWHAP Part A funding; all visualizations include data for all clients served by RWHAP providers in the EMA or TGA, regardless of the source of RWHAP funding (i.e., Parts A, B, C, and D data are included). Federal Poverty Level (FPL) Federal poverty level is a measure of income issued every year by the U.S. Department of Health and Human Services (HHS) and characterizes the client’s income as a percentage of the FPL at the end of the reporting period. See https://www.healthcare.gov/glossary/federal-poverty-level-fpl/. Health Care Coverage RWHAP grant recipients and subrecipients report all sources of health care coverage that each client had for any part of the reporting period. These data are further categorized for analysis. From 2010 through 2013, health care coverage was categorized as private only, Medicare only, Medicaid only, other public, other private, multiple coverages, and no coverage (uninsured). The categorization schema was changed in the 2014 RSR to include a more granular classification of health care coverage. From 2014 through 2019, health care coverage was categorized as private employer, private individual, Medicare, Medicaid, Medicare and Medicaid (dual eligibility), Veterans Administration, Indian Health Service, other plan, multiple coverages, and no coverage. The Medicaid classification also includes the Children’s Health Insurance Program (CHIP) and other public state health care coverage programs. Housing Status The housing status variable captures the client’s housing status at the end of the reporting period and is categorized as stable, permanent housing, temporary housing, or unstable housing. The definitions for each of these categories are based on the Housing Opportunities for Persons with AIDS Program Annual Progress Report Measuring Performance Outcomes (https://www.hudexchange.info/programs/hopwa/). National HIV/AIDS Strategy The National HIV/AIDS Strategy (NHAS) is a roadmap for ending the HIV epidemic in the U.S. by 2030. NHASis the nation’s third consecutive five-year national HIV strategy and covers 2022-2025, with a 10-year goal of reducing new HIV infections by 90% by 2030. The goals of the NHAS are to prevent new HIV infections, improve HIV-related health outcomes of people with HIV, reduce HIV-related disparities and health inequities, and achieve integrated, coordinated efforts that address the HIV epidemic among all partners and stakeholders. The NHAS includes several goals and indicators, one of which is to increase viral suppression among people with diagnosed HIV to 95% by 2025. The RWHAP Compass Dashboard adopts this viral suppression goal from the NHAS, and identifies an aligned goal to increase retention in care among people with diagnosed HIV to 95% by 2025 ( https://www.hiv.gov/federal-response/national-hiv-aids-strategy/national-hiv-aids-strategy-2022-2025). Number of Clients Served Screens that display the number of clients served (e.g., Characteristics of RWHAP Clients), include all RWHAP clients, regardless of HIV serostatus. This means the data include people with HIV as well as clients who are missing HIV serostatus information (e.g., clients who receive services that do not require serostatus to be reported, such as medical transportation services) and clients who do not have HIV (i.e., the families of people with HIV who are able to receive certain RWHAP services). For example, in 2020, people with HIV represented an estimated 98.7% of all RWHAP clients. Outcome Measures Screens displaying outcome measure data (i.e., retention in care and viral suppression) include only people with HIV who also meet the criteria for that specific outcome measure. It is important to be aware that the denominator is not the same for all calculations visualized on Retention in care and viral suppression data for the RWHAP should be interpreted carefully. Because these data are reported annually and de-identified, an individual client cannot be tracked across years. This affects how HIV-related outcomes are calculated (see below). RWHAP clients who are not included in retention in care or viral suppression calculations did not meet inclusion criteria for those calculations but would have received at least one other RWHAP service (e.g., non-medical case management, housing, transportation, food bank/home-delivered meals). It is also important to note that these clients excluded from retention in care or viral suppression calculations may receive medical care at RWHAP clinics, where primary medical care services are paid using non-RWHAP-related funding sources (e.g., private, public, or other health care coverage types), or may receive care from providers outside the RWHAP system; these clients should not be presumed to be “out of care.” Retention in Care Retention in HIV medical care was defined as people with HIV who had at least two medical visit dates that were at least 90 days apart in the measurement year. Because the data sets are restricted to one calendar year of data each, the first of these HIV medical care visits in the year must have occurred before September 1 of the measurement year, thus giving the client an opportunity to meet the retention criteria by December 31. Viral Suppression Viral suppression was calculated among people with HIV who had at least one OAHS visit and at least one viral load test during the measurement year. Viral suppression was defined as a most recent viral load test result of <200 copies/mL. Race/Ethnicity Recipients and subrecipients report race/ethnicity information for RWHAP clients according to Office of Management and Budget standards. Race and ethnicity are submitted as separate variables and combined for analysis. The race/ethnicity variable is categorized as American Indian or Alaska Native, Asian, Black or African American, Hispanic or Latino, Native Hawaiian or other Pacific Islander, White, and multiple races (i.e., two or more categories of race reported). In this dashboard, clients categorized by race were not Hispanic or Latino; the number of clients reported in each race category may, however, include clients whose ethnicity was not reported. The RWHAP grant recipients and subrecipients are expected to make every effort to obtain and report race and ethnicity, based on each client's self-report. Self-identification is the preferred means of obtaining this information. States and Territories Client-level data are reported by RWHAP grant recipients and subrecipients in 50 states, the District of Columbia, and three territories—Guam, Puerto Rico, and the U.S. Virgin Islands. Five of the six U.S. Pacific territories (excludes Guam) do not submit client-level data and, therefore, are not included in this report. Due to reporting challenges during the coronavirus disease 2019 (COVID-19) pandemic, Guam’s 2019 and 2020 RSR data are unavailable. State-level analyses include data submitted for all parts of the RWHAP. In addition, state delineation of data is based on provider location, rather than client location. Transmission Category Transmission category is the term for the classification that summarizes a client’s possible HIV risk factor(s) at the time of HIV acquisition. The summary classification results from selecting – from a presumed hierarchical order of probability – the single risk factor most likely to have been responsible for transmission. Transmission categories are presented separately by gender (i.e., male, female, transgender). For male clients, transmission categories include male-to-male sexual contact, injection drug use, male-to-male sexual contact and injection drug use, heterosexual contact, perinatally acquired HIV, and other. For female clients, transmission categories include heterosexual contact, injection drug use, perinatally acquired HIV, and other. For transgender clients, transmission categories have been modified to be more reflective of the transgender experience of transmission while continuing to follow a relative hierarchy of likelihood for transmission. That is, transmission category data for transgender clients are presented as sexual contact, injection drug use, sexual contact and injection drug use, perinatally acquired HIV, and other. The definitions of transmission categories are adapted from CDC’s National HIV Surveillance System (NHSS) definitions for transmission categories. Clients with more than one reported risk factor are classified in the transmission category listed first in the hierarchy. The only exceptions are (1) men who had sexual contact with other men and who injected drugs and (2) perinatally acquired HIV. It is important to note that data by transmission category are based on the reported risk factor most likely to have been responsible for the original transmission of HIV; data may not be reflective of current behavior (e.g., injection drug use). These groups make up separate transmission categories, which are defined in order of the hierarchy as follows:
For transgender clients, the following transmission category hierarchy is used:
| |
Accessing Dashboard in the EHBs | ||
|---|---|---|
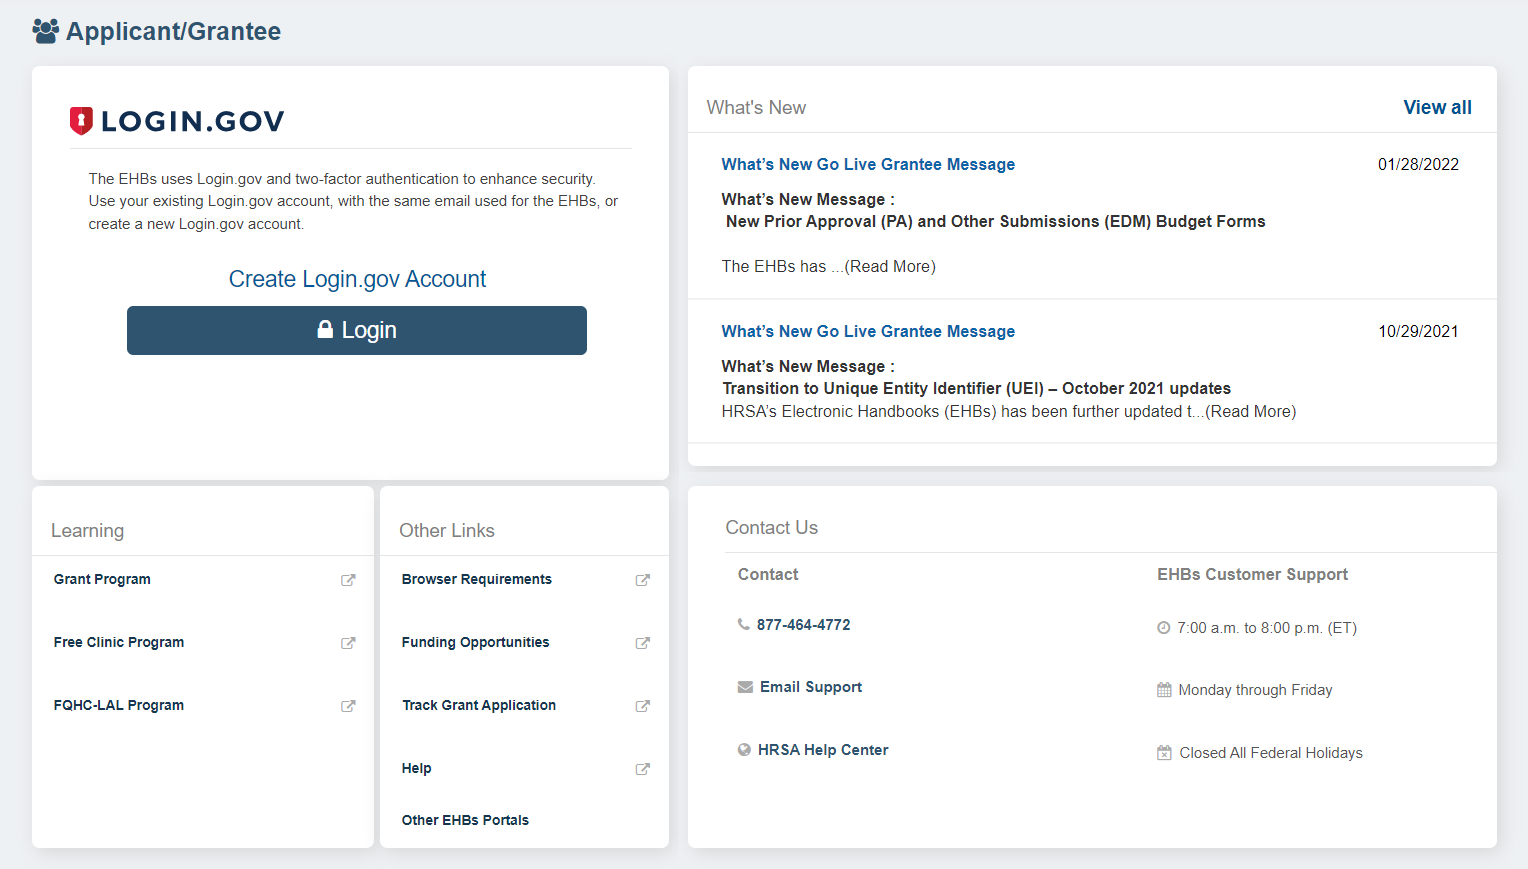
| 1 | Login to the EHBs (https://grants.hrsa.gov) as a Grantee using Login.gov and two-factor authentication. For information about logging into the EHBs and Login.gov, refer to the EHBs Login Process help pages. | |
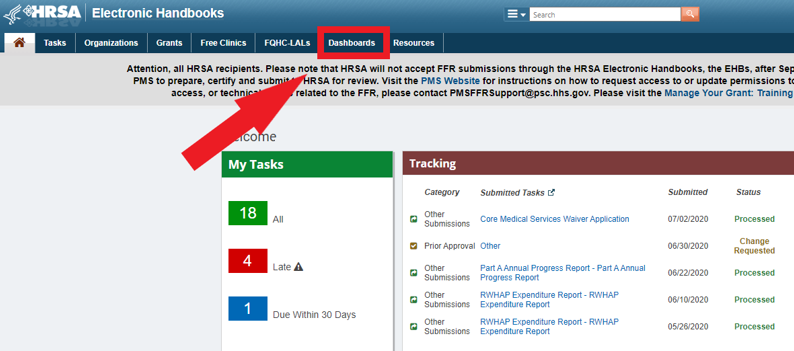
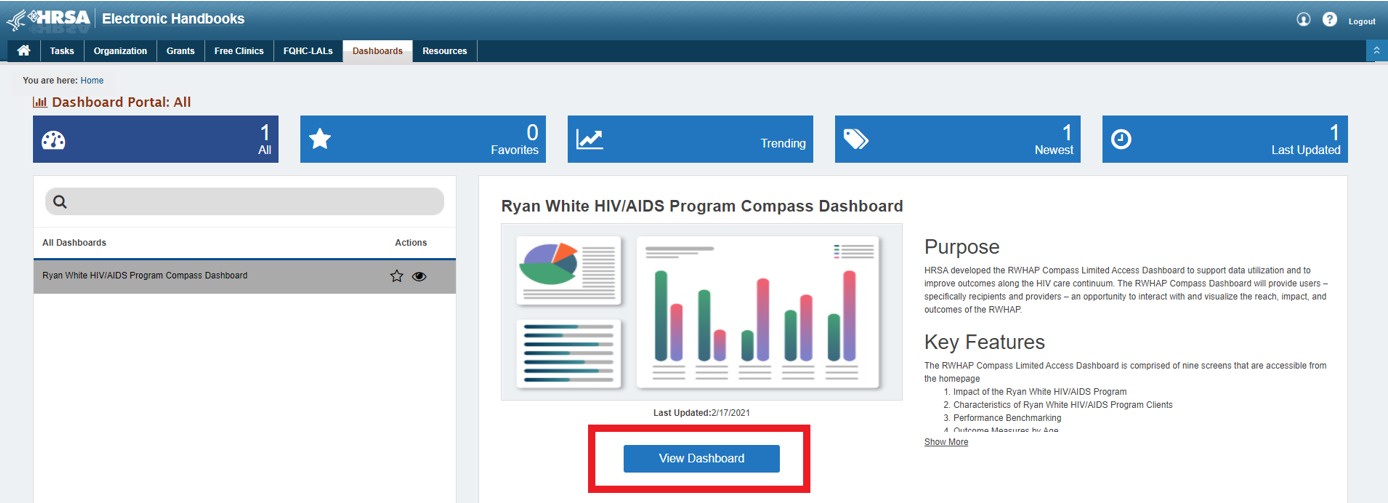
| 2 | You will land on the EHBs Home page. Click on Dashboards on the Top Menu. | |
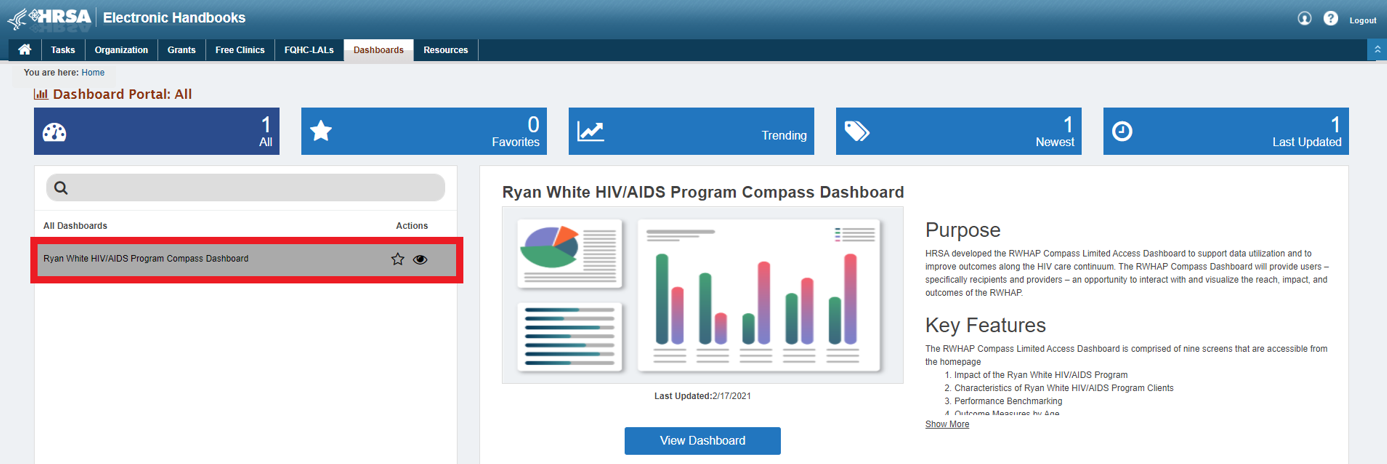
| 3 | You will land on the Dashboards list page, listing all the available dashboards for your role. | |
| 4 | Once on the Dashboards list page, click on the View Dashboard link for Ryan White HIV/AIDS Program Compass dashboard. | |
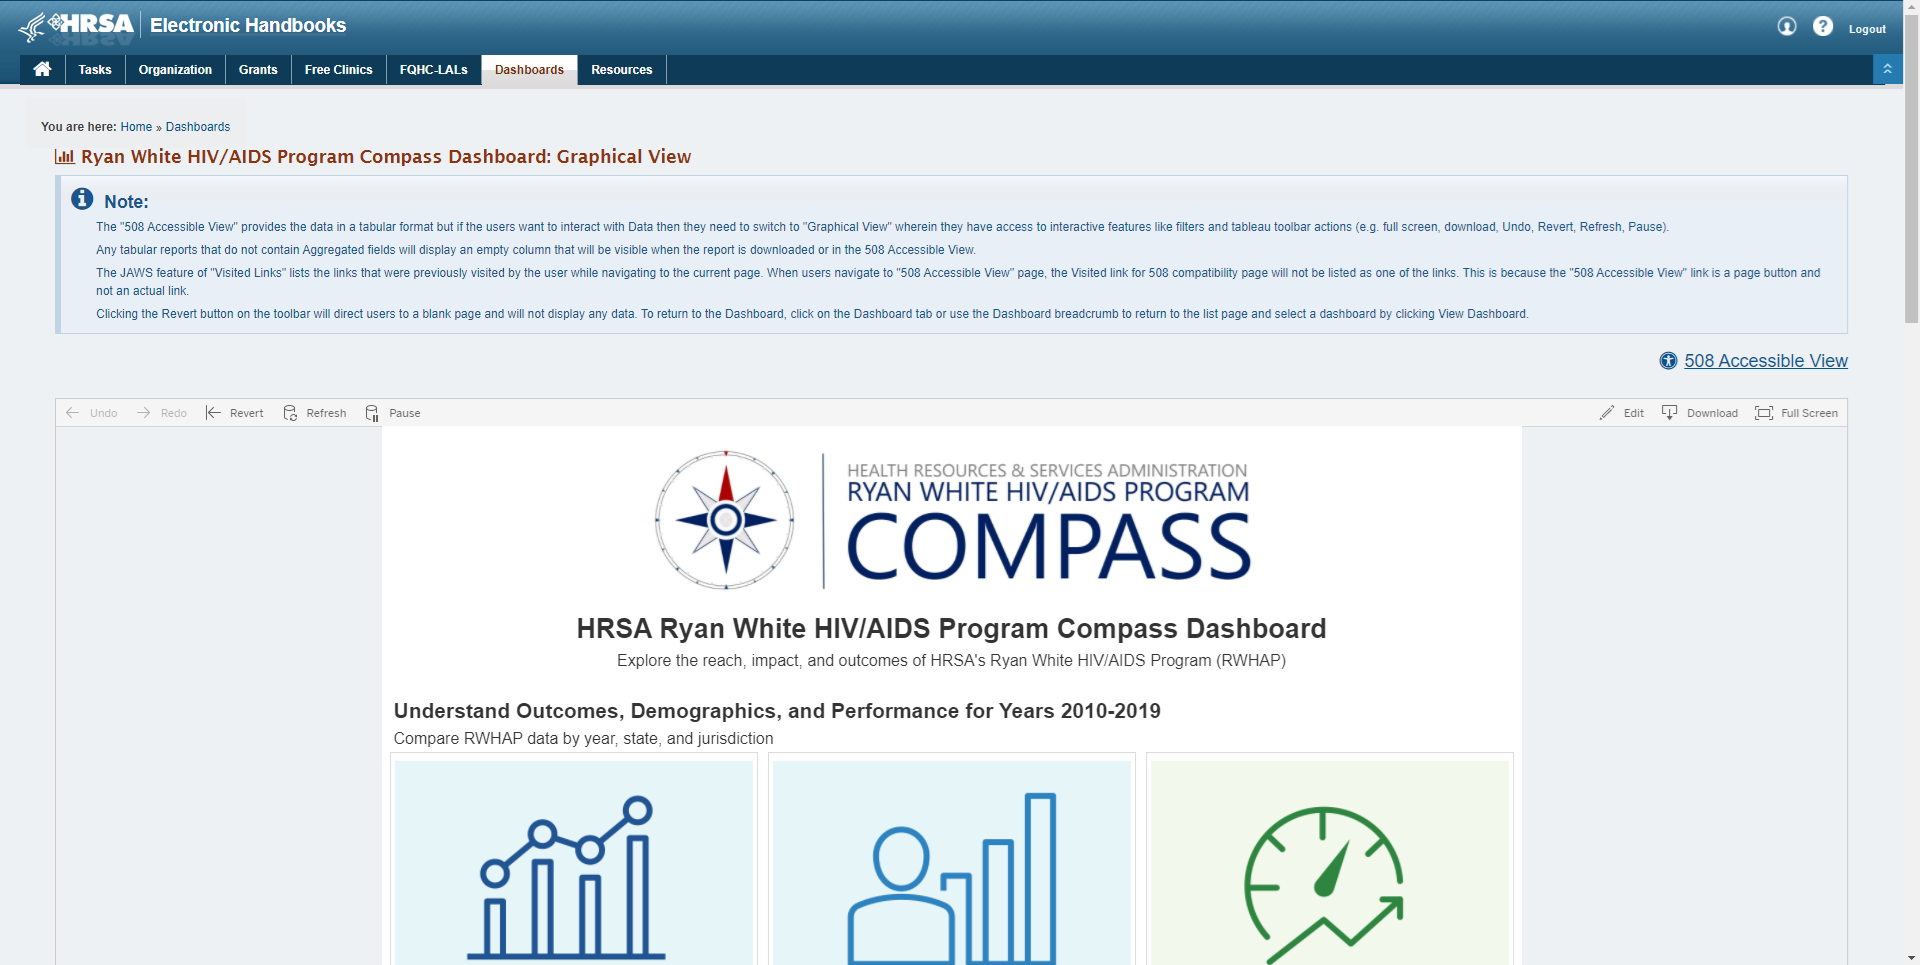
| 5 | You will land on the Ryan White HIV/AIDS Program Compass dashboard. | |
