Coming soon!
BHW Grantee Balanced Scorecard Dashboard | ||
|---|---|---|
BHW Grantee Balanced Scorecard Dashboard presents the snapshot of different performance metrics. Filters for ‘Academic Year’ (single-select) and ‘Grant Number and Grantee Name’ (single-select) allow the user to refine data on the page. This page has four sections displayed in three different visualizations as below
| ||
Grantee Scorecard - Trainees Information (Number) Charts | ||
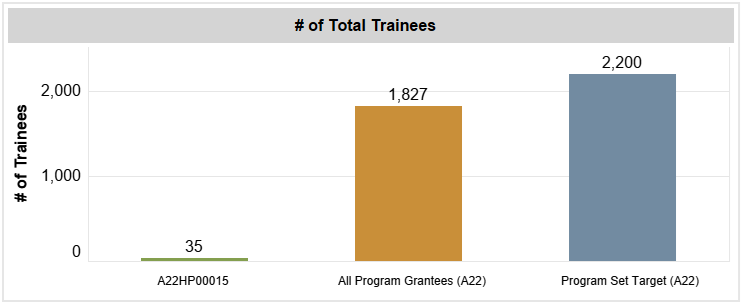
Chart 1: # of Total Trainees The # of Total Trainees chart provides information about Total Trainees for the selected Academic Year and Grantee. It also shows the performance of All Program Grantees compared with Program Set Target (if applicable). |
| |
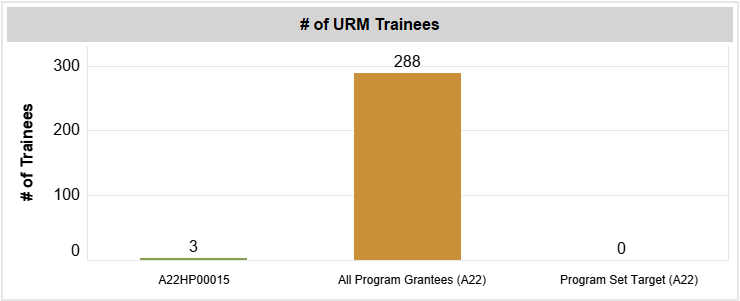
Chart 2: # of URM Trainees
The # of URM Trainees chart provides information about URM Trainees for the selected Academic Year and Grantee. It also shows the performance of All Program Grantees compared with Program Set Target (if applicable). |
| |
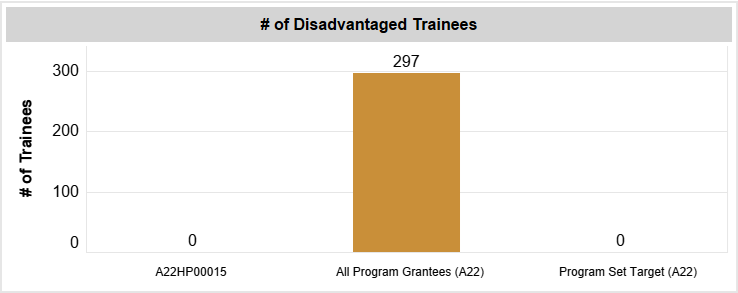
Chart 3: # of Disadvantaged Trainees
The # of Disadvantaged Trainees chart provides information about Disadvantaged Trainees for the selected Academic Year and Grantee. It also shows the performance of All Program Grantees compared with Program Set Target (if applicable). |
| |
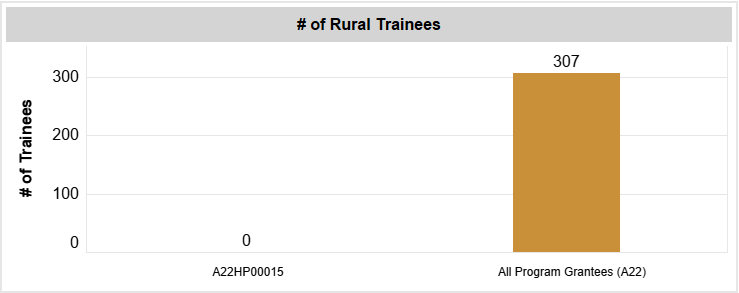
Chart 4: # of Rural Trainees
The # of Rural Trainees chart provides information about Rural Trainees for the selected Academic Year and Grantee. It also shows the performance of All Program Grantees. |
| |
Grantee Scorecard - Trainees Information (Percentage) Charts | ||
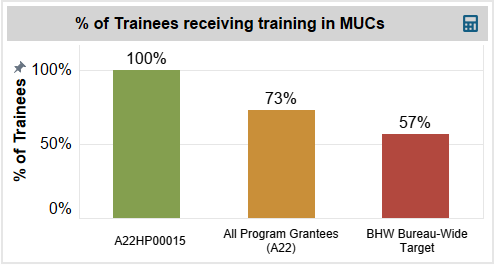
Chart 1: % of Trainees receiving training in MUCs |
| |
Chart 2: % of Trainees receiving training in Primary Care Setting The % of Trainees receiving training in Primary Care Setting chart provides information about Trainees receiving training in Primary Care Setting for the selected Grantee performance compared with the performance of All Program Grantees and BHW Bureau-Wide Targets. |
| |
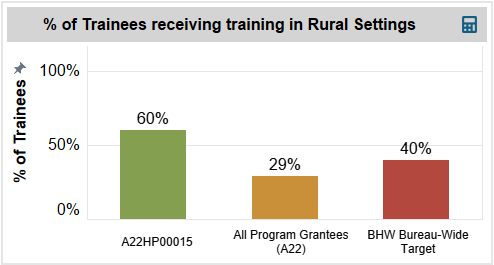
Chart 3: % of Trainees receiving training in Rural Settings The % of Trainees receiving training in Rural Settings chart provides information about Trainees receiving training in Rural Settings for the selected Grantee performance compared with the performance of All Program Grantees and BHW Bureau-Wide Targets. |
| |
Grantee Scorecard - Graduates Information Charts | ||
Chart 1: Graduates Information from INDGEN (Percentage)
The Graduates Information from INDGEN (Percentage) chart provides information about Graduates from INDGEN compared with BHW Bureau-Wide Targets. When there are two vertical reference lines, it represents the range of the BHW Bureau-Wide target. |
| |
Chart 2: Graduates Information from INDGEN-PY (Percentage)
The Graduates Information from INDGEN-PY (Percentage) chart provides information about Graduates from INDGEN-PY compared with BHW Bureau-Wide Targets. When there are two vertical reference lines, it represents the range of the BHW Bureau-Wide target. |
| |
Grantee Scorecard - Training Sites Charts | ||
Chart 1: EXP Training Sites Information (Percentage)
The EXP Training Sites Information (Percentage) chart provides information about the training sites from EXP compared with BHW Bureau-Wide Targets. |
| |
Accessing Dashboards in the EHBs | ||
|---|---|---|
Login to the EHBs (https://grants.hrsa.gov) using your HRSA EHBs username and password. You will land on the EHBs Home page. You will land on the EHBs Home page. Click on Dashboards on the Top Menu. |
| |
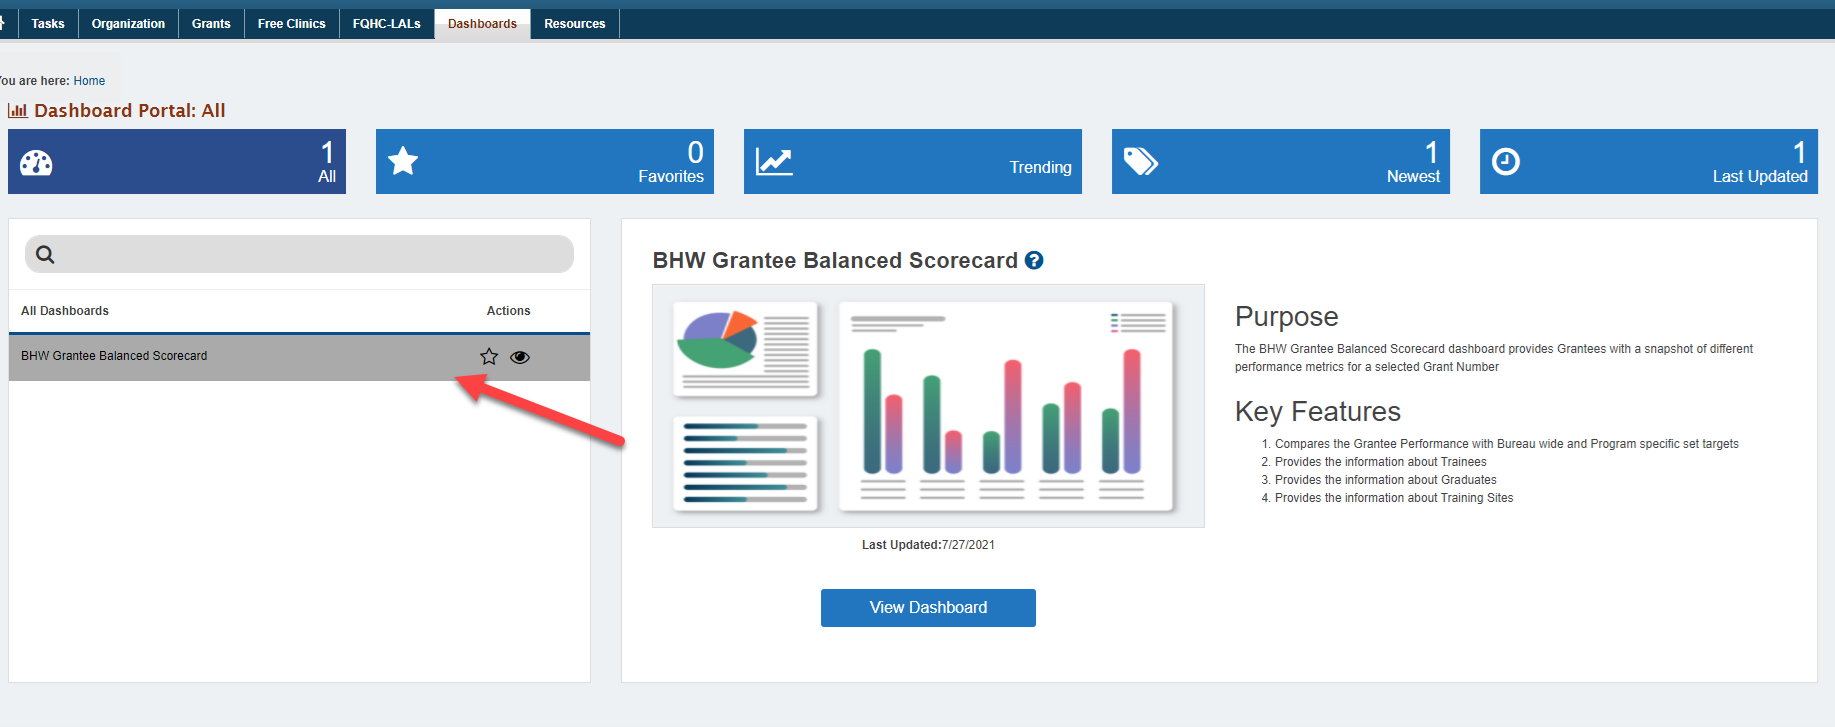
| You will land on the Dashboards page, listing all the available dashboards for your role. |
| |
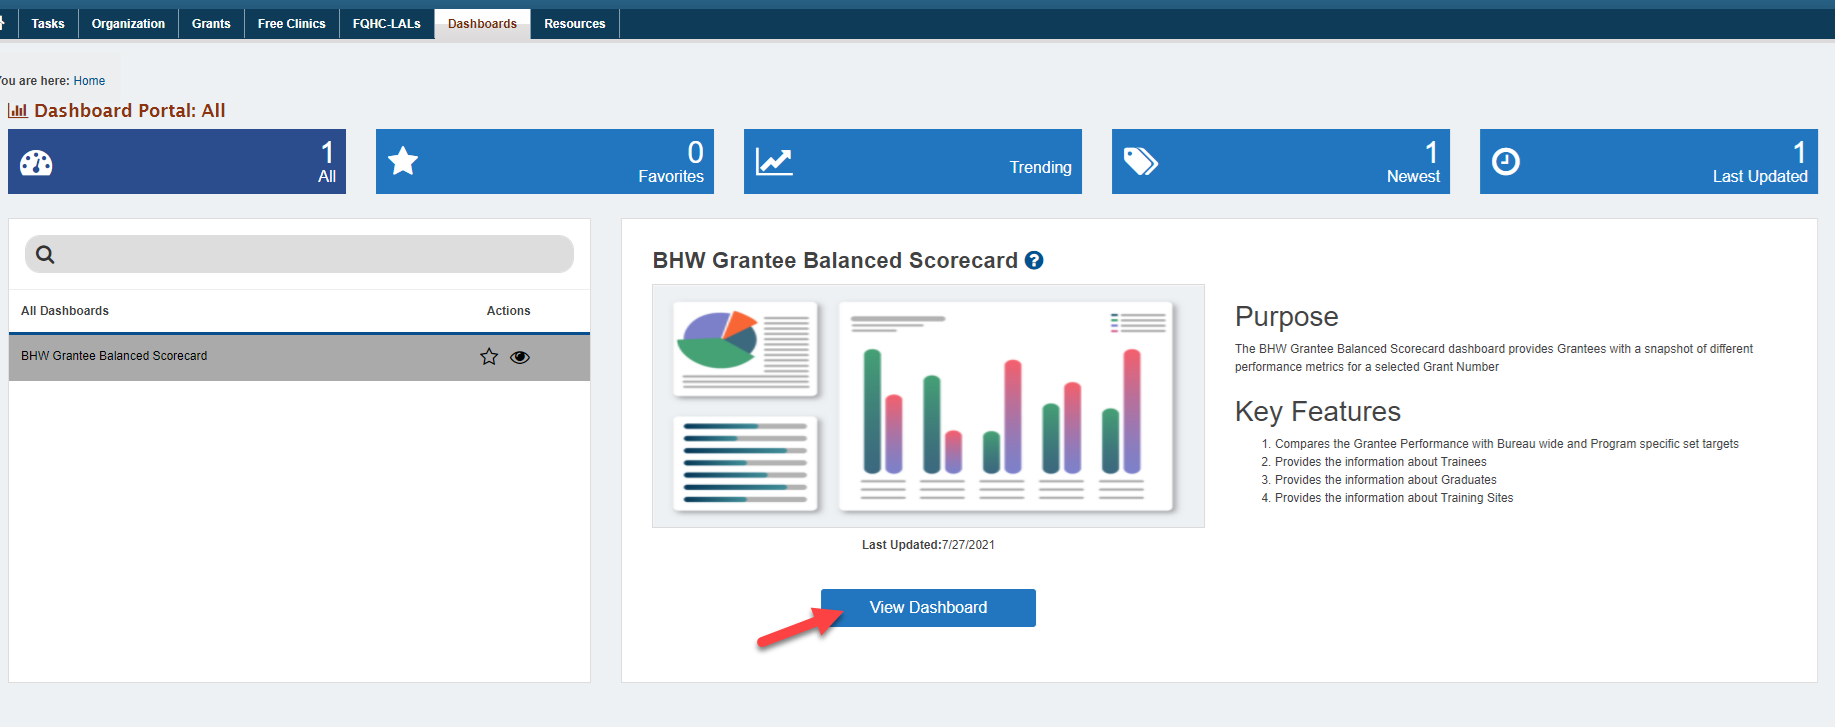
Once on the Dashboards List page, you can view more information about the dashboard, including Purpose and Key Features. Click on the View Dashboard link for the BHW Grantee Balanced Scorecard dashboard. Important note: If you do not see the BHW Grantee Balanced Scorecard Dashboard in the list, please contact BHWData@hrsa.gov |
| |
| You will land on the BHW Grantee Balanced Scorecard dashboard. |
| |
Downloading as Data, Crosstab, and PDF | ||
|---|---|---|
Download as “Data” format. By default, the “Data” and “Crosstab” options will not be activated. | ||
To download the tabular format, click on the table graph on the dashboard. In the below image, the # of Total Trainees was selected. The “Data” and ” Crosstab” options are now activated. | ||
Similarly, if “Data” from the download options is selected, the data view is displayed and can be downloaded as a text file. | ||
The downloaded excel file will show data as: | ||
| Click on “Crosstab” and the data will be downloaded as an Excel file and shown as: | ||
Downloading a Dashboard as a PDF - To download a dashboard as a PDF, click on the download link and select “PDF” as shown. | ||
| After clicking “PDF”, the download PDF window will be displayed. Select “This View” and click on “Create PDF”. | ||
| A PDF will be generated and downloaded. | ||
