Dashboards |
|---|
Summary Dashboard |
Summary of Measure-Level Improvement Results This dashboard displays the summary of results of measure-level improvement across all 19 performance measures of the MIECHV Demonstration of Improvement requirements. Refer to Figure 1. The Met Measure-Level Improvement column in the tabular visualization displays whether the respective performance measure has met the measure-level criteria for demonstrating improvement The definition for Measure-Level Improvement, Baseline and National Threshold are displayed below the tabular visualization. This visualization can be filtered by the reporting fiscal year, state, and organization. State filter is a single select and it gives an ability to filter the data for different states. State filter on the dashboard represents the physical state of the awardee organization. |
Benchmark I Dashboard |
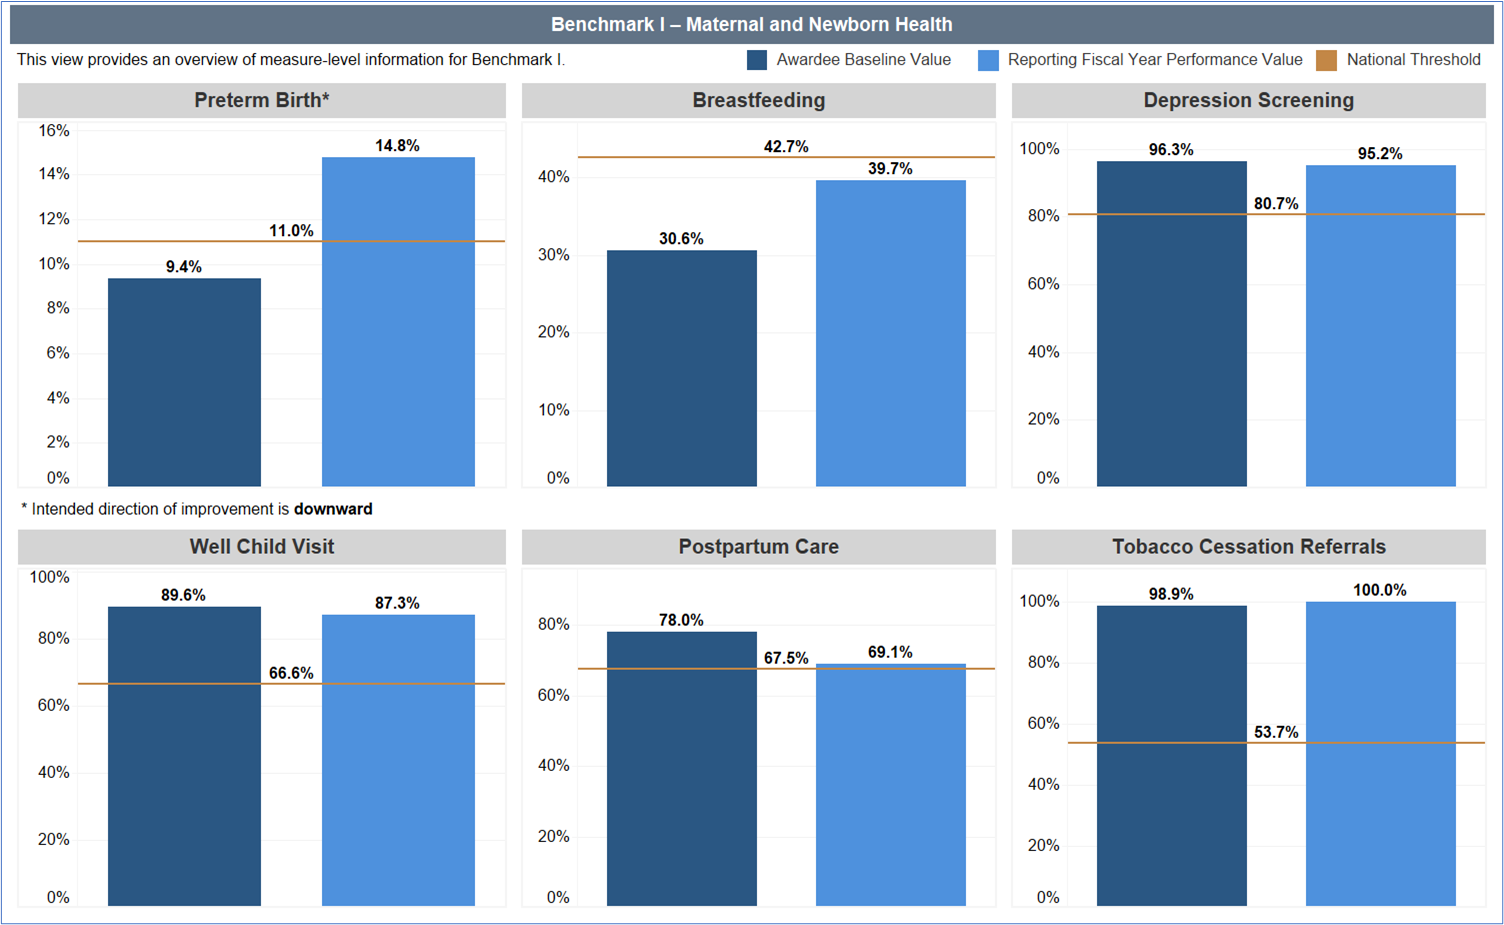
Benchmark I - Maternal and Newborn Health This dashboard displays an overview of the following measure-level information for the Maternal and Newborn Health benchmark: The awardee baseline values and reporting fiscal year performance values for the performance measures are displayed using bar charts. The reporting fiscal year can be selected from the ‘Select Reporting Fiscal Year’ filter on the dashboard. The national threshold value for the performance measures is represented by a reference line with the label denoting the value of the National Threshold. On hovering over the bar charts for the performance measures, the tooltip displays the Met Measure level improvement information for the respective performance measures. |
Benchmark II Dashboard |
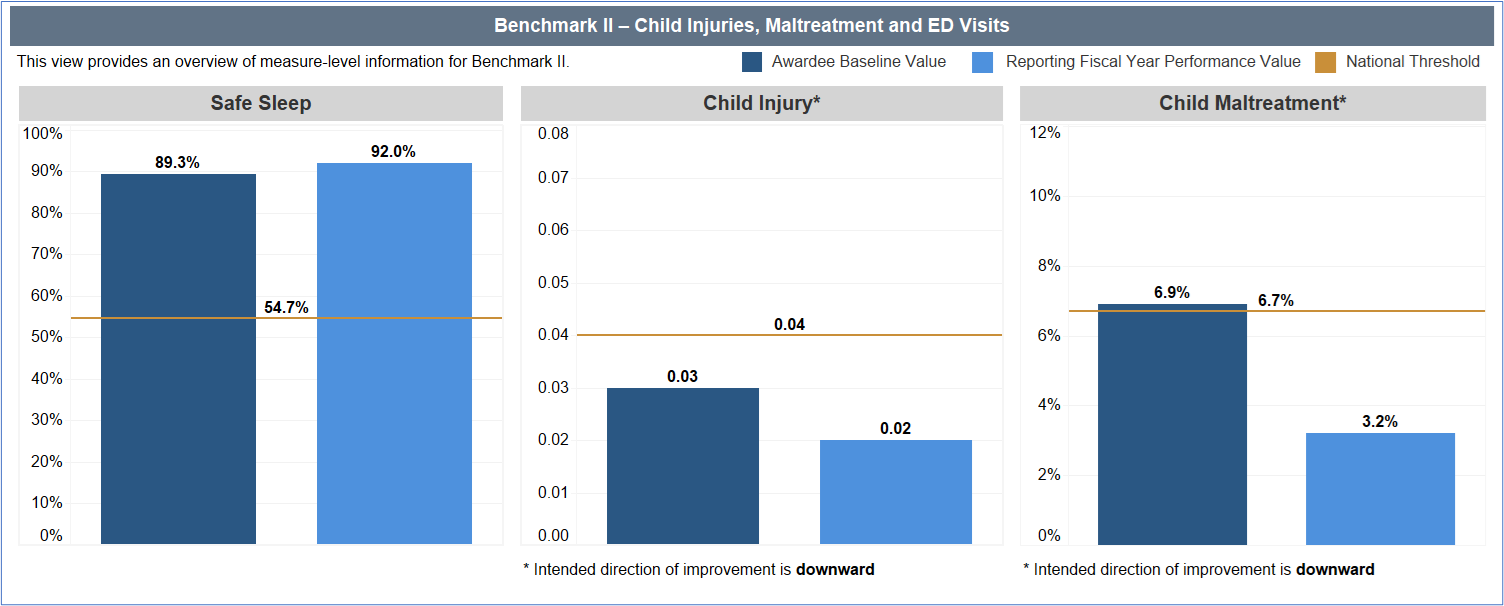
Benchmark II – Child Injuries, Maltreatment and Reduction of ED visits This dashboard displays an overview of the following measure level information for the Child Injuries, Maltreatment and Reduction of ED visits benchmark:
The awardee baseline values and reporting fiscal year performance values for the performance measures are displayed using bar charts. The reporting fiscal year can be selected from the ‘Select Reporting Fiscal Year’ filter on the dashboard. The national threshold value for the performance measures is represented by a reference line with the label denoting the value of the National Threshold. On hovering over the bar charts for the performance measures, the tooltip displays the Met Measure level improvement information for the respective performance measures. |
Benchmark III Dashboard |
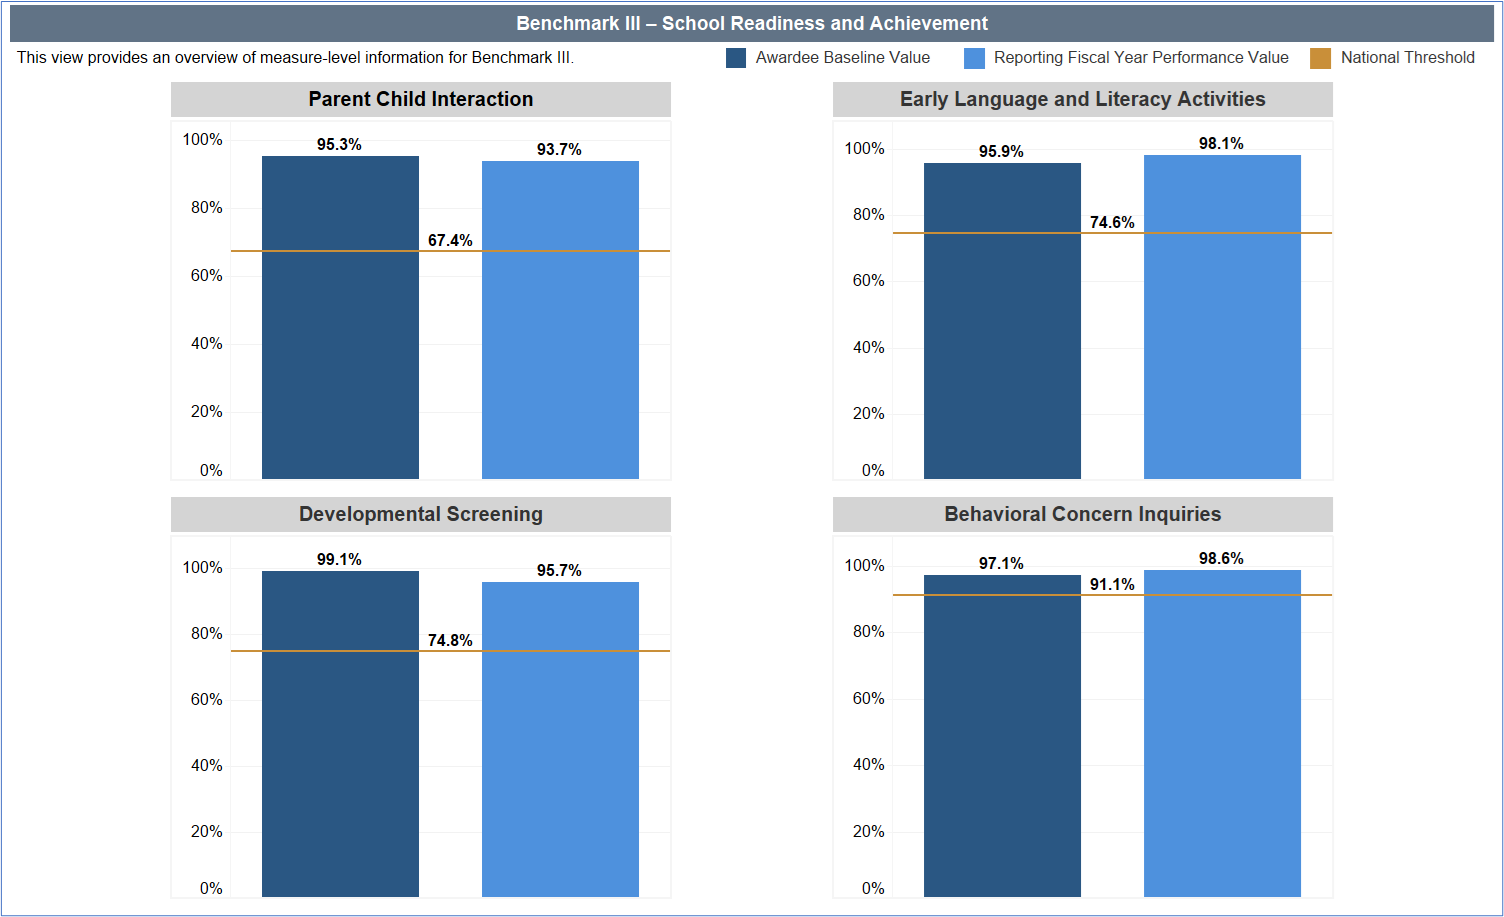
Benchmark III – School Readiness and Achievement
The awardee baseline values and reporting fiscal year performance values for the performance measures are displayed using bar charts. The reporting fiscal year can be selected from the ‘Select Reporting Fiscal Year’ filter on the dashboard. The national threshold value for the performance measures is represented by a reference line with the label denoting the value of the National Threshold. On hovering over the bar charts for the performance measures, the tooltip displays the Met Measure level improvement information for the respective performance measures. |
Benchmark IV Dashboard |
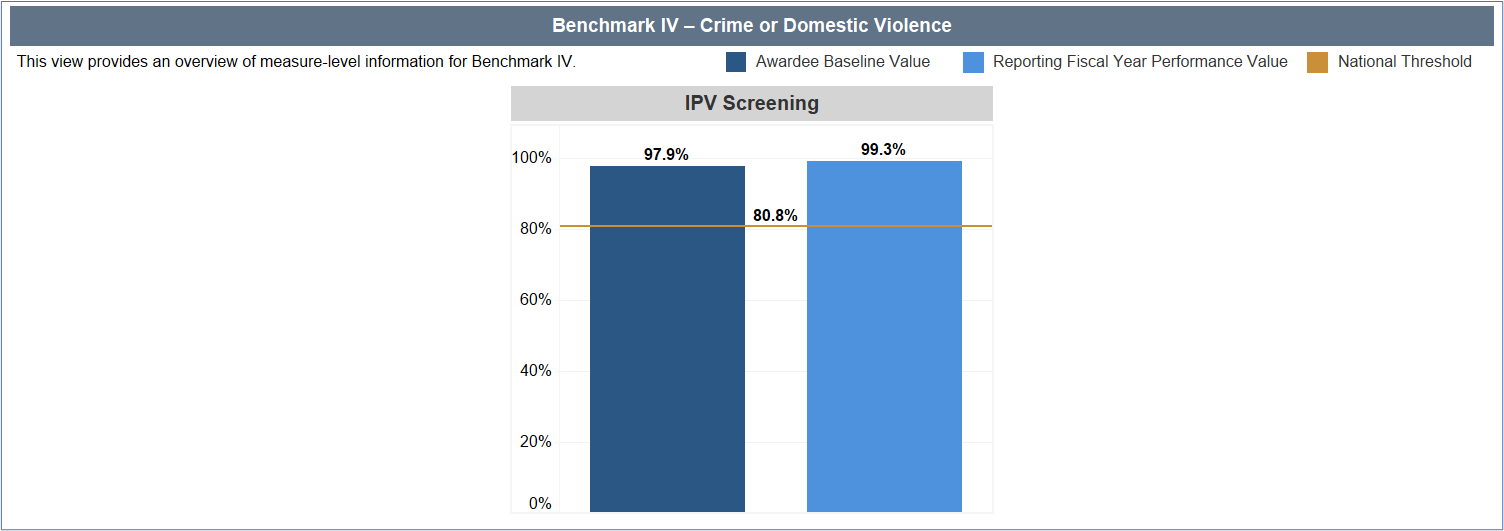
Benchmark IV – Crime or Domestic Violence This dashboard displays an overview of the following measure level information for the Crime or Domestic Violence benchmark:
The awardee baseline values and reporting fiscal year performance values for the performance measures are displayed using bar charts. The reporting fiscal year can be selected from the ‘Select Reporting Fiscal Year’ filter on the dashboard. The national threshold value for the performance measures is represented by a reference line with the label denoting the value of the National Threshold. On hovering over the bar charts for the performance measures, the tooltip displays the Met Measure level improvement information for the respective performance measures. |
Benchmark V Dashboard |
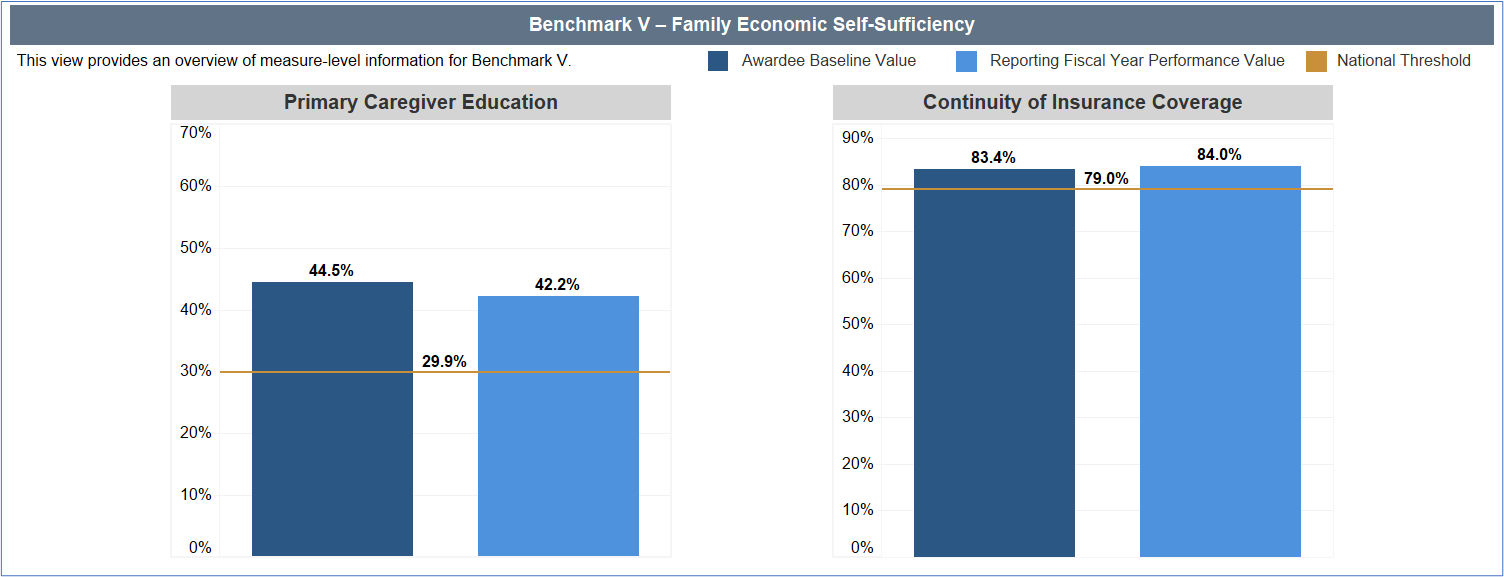
Benchmark V – Family Economic Self Sufficiency This dashboard displays an overview of the following measure level information for the Family Economic Self Sufficiency benchmark:
The awardee baseline values and reporting fiscal year performance values for the performance measures are displayed using bar charts. The reporting fiscal year can be selected from the ‘Select Reporting Fiscal Year’ filter on the dashboard. The national threshold value for the performance measures is represented by a reference line with the label denoting the value of the National Threshold. On hovering over the bar charts for the performance measures, the tooltip displays the Met Measure level improvement information for the respective performance measures. |
Benchmark VI Dashboard |
Benchmark VI – Coordination and Referrals This dashboard displays an overview of the following measure level information for the Coordination and Referrals benchmark:
The awardee baseline values and reporting fiscal year performance values for the performance measures are displayed using bar charts. The reporting fiscal year can be selected from the ‘Select Reporting Fiscal Year’ filter on the dashboard. The national threshold value for the performance measures is represented by a reference line with the label denoting the value of the National Threshold. On hovering over the bar charts for the performance measures, the tooltip displays the Met Measure level improvement information for the respective performance measures. |
Accessing External HVIS Grantee Dashboards | |
|---|---|
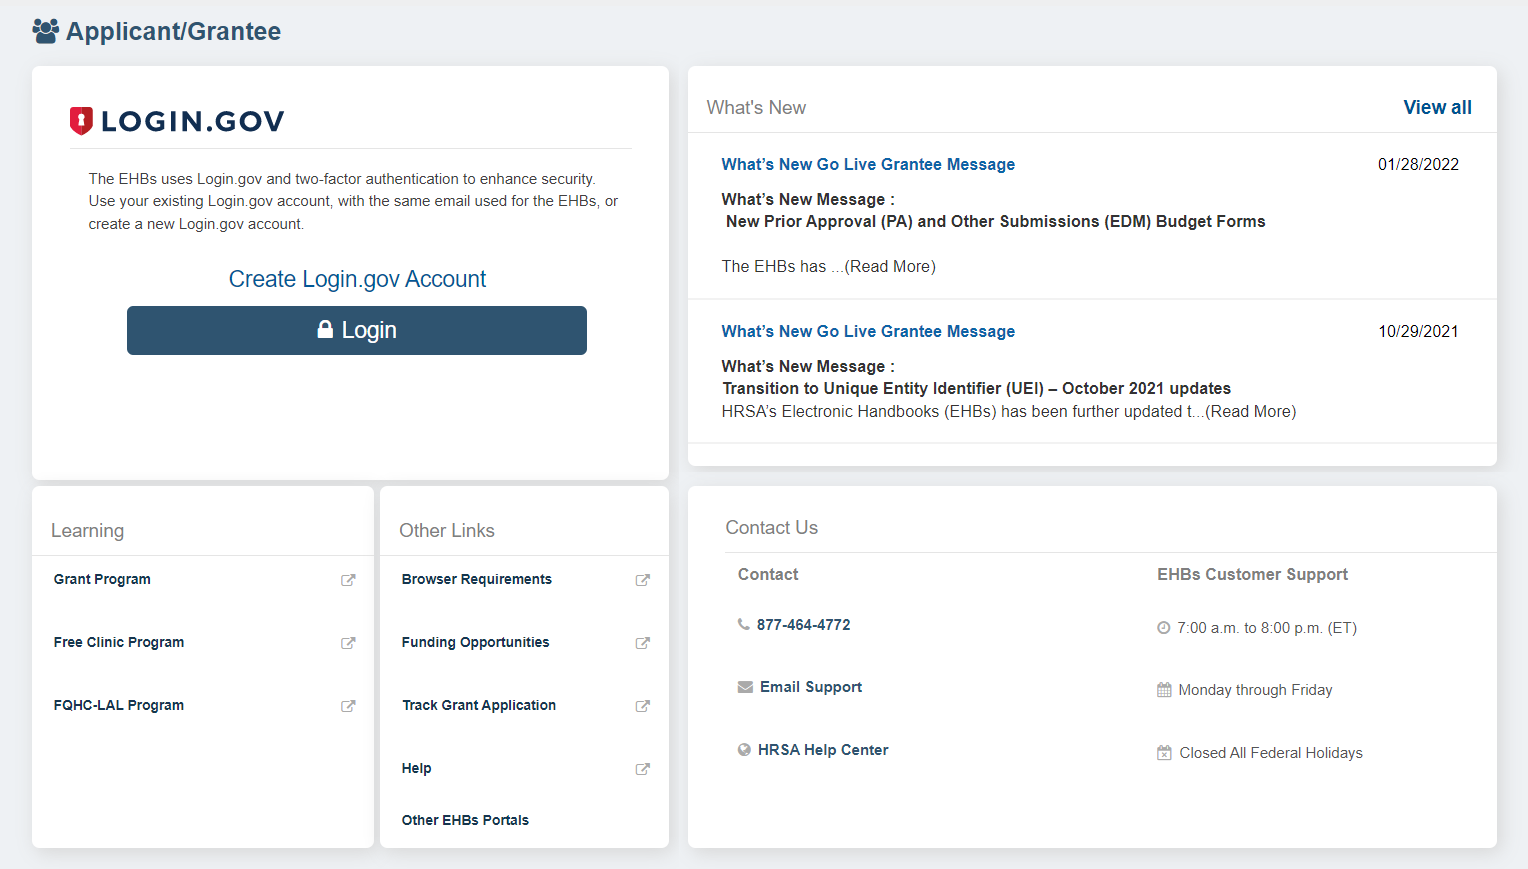
Login to HRSA Grants EHBs. For information about logging into the EHBs, refer to the EHBs Login Process help pages. | |
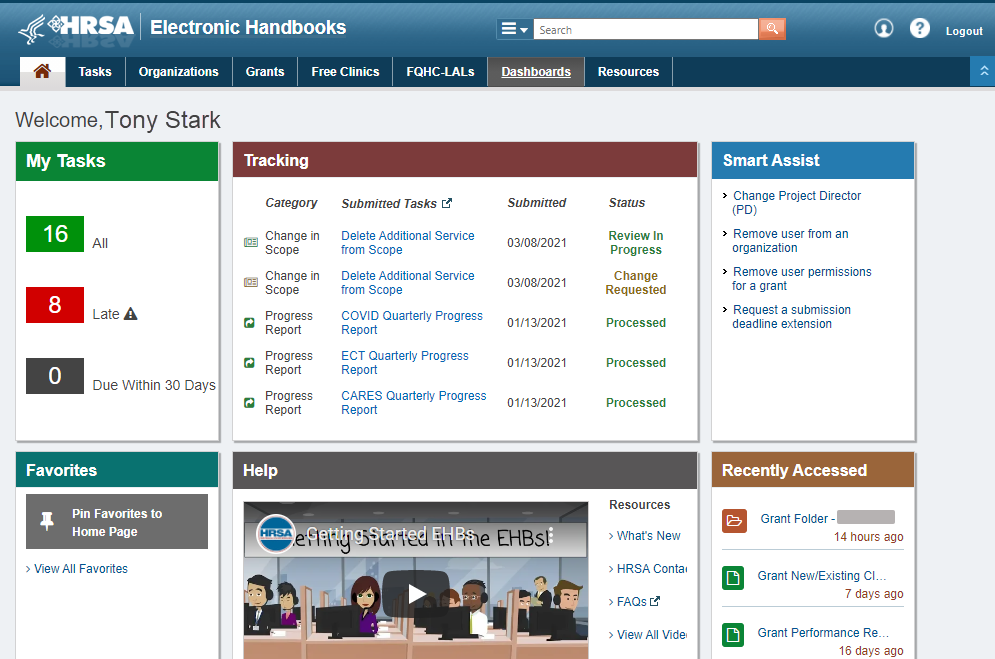
Click on “Dashboards” on the Top Menu. | |
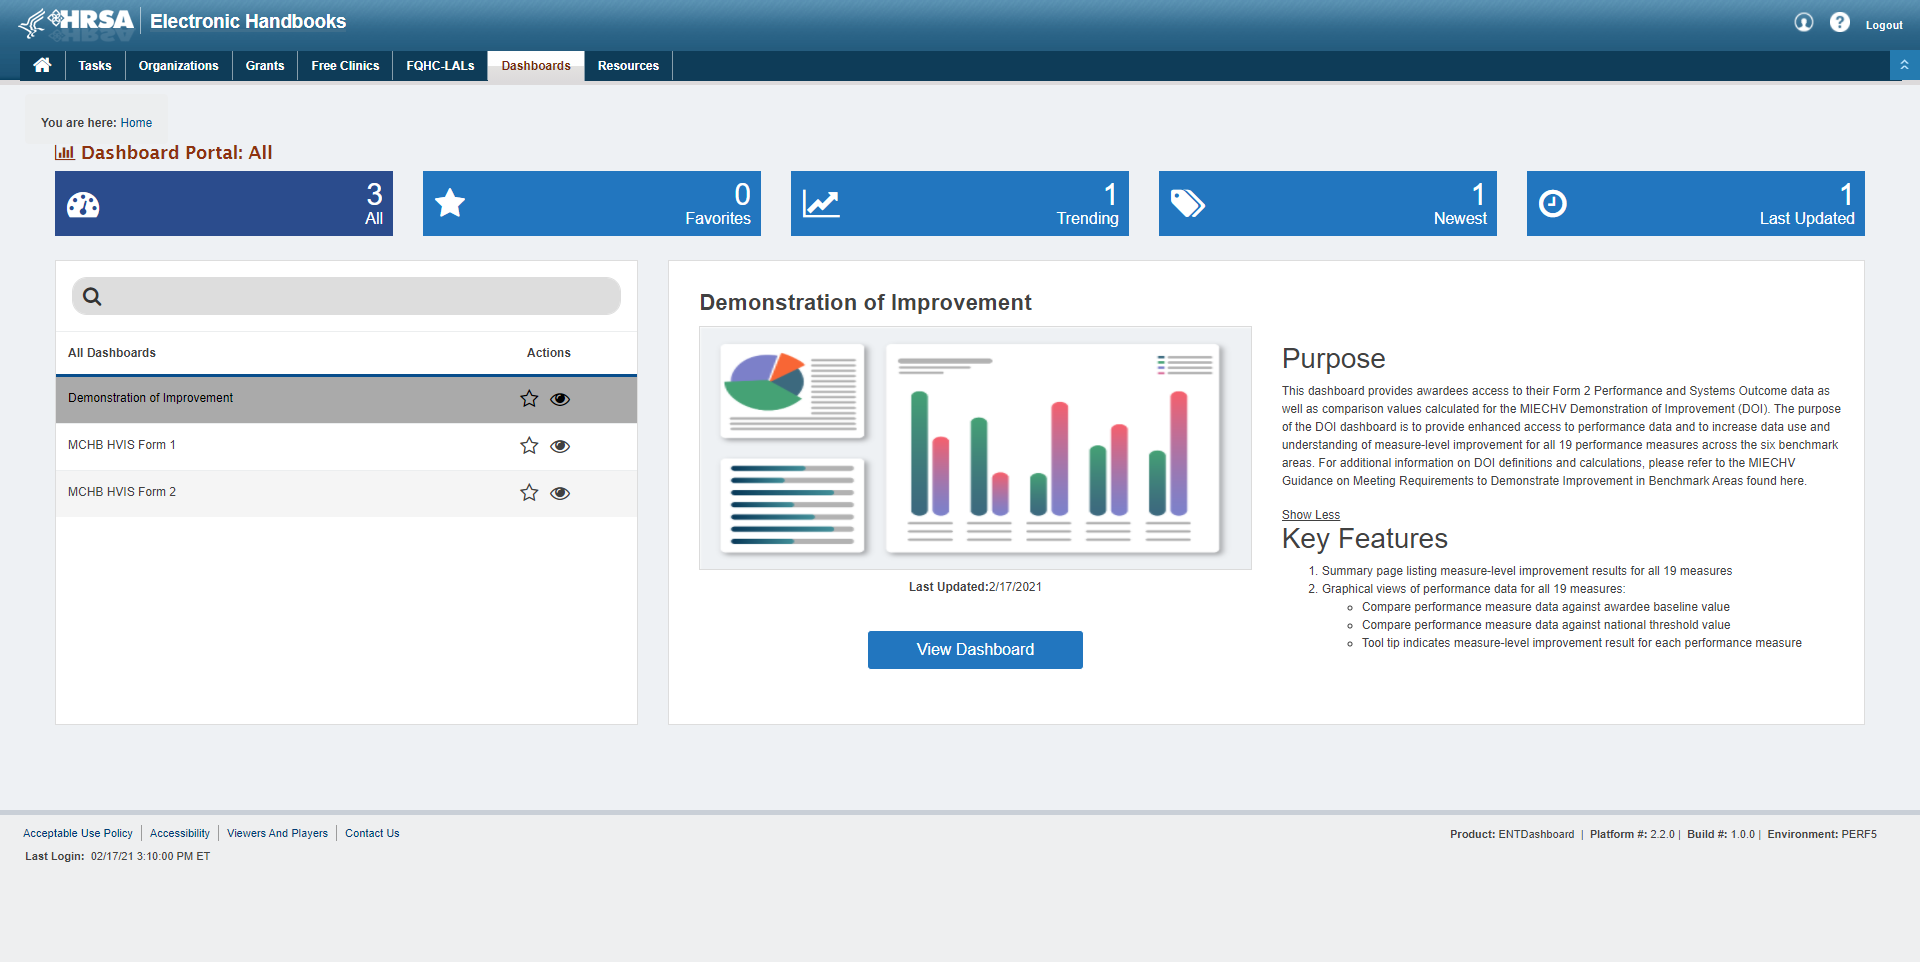
You see the Dashboards Portal page where you will see all the available dashboards for your role. Click on "View Dashboard” link for “Demonstration of Improvement” dashboard. | |
You will land on the “Demonstration of Improvement” dashboard. | |

