Performance Measures (PM) Overview | |
|---|---|
The Healthy Start program has established benchmarks and goals for performance. The purpose of the Performance Measures dashboard is to present an overview of grantee’s 14 Performance Measures, and the Healthy Start benchmarks for each, to inform data quality assurance and overall program improvement efforts. Summary cards with details on how each Performance Measure is calculated and the counts are also provided. All performance measure calculations include only “active” participants in the reporting year. In the case of women participants, a participant is considered as active based on the Primary Participant Enrollment Date in the reporting year (calendar year) Or Other Update Date in the reporting year (calendar year) on any form. In the case of child participants, a participant is considered as active based on the Child Enrollment Date in the reporting year (calendar year) Or Other Update Date in the reporting year (calendar year) in the parent child form. The dashboard includes Recipient filter and multi-select filters for Reporting Year and Reporting Month served. | |
Performance Measures (PM) Summary Cards | |
Dashboard line chart and summary cards indicate the numerator, denominator, and percentage calculations for each Performance Measure. The line chart and summary card information is dependent on the selected Performance Measure filter. They will identify the values used to determine Performance Measure numerator value, denominator value, and percentage value. The drop-down menu in the ‘Performance Measure’ filter can be used to select individual Performance Measures and see the counts for each measure in the line chart and summary cards. | |
In this case the summary cards identify the number of women with health insurance (numerator), the number of women overall in the program (denominator), and the resulting percentage of those values. Note: The Summary cards will display blank or '-' (i.e., no information) to indicate that no participants met the inclusion criteria for that given Performance Measure, and ‘0’ when the metric calculation returns zero to the corresponding filter(s) applied. | |
Performance Measures (PM) Table | |
Performance Measures Table: This table provides an overview of all the Performance Measure percentage values for the selected recipient and dates, and the Healthy Start desired benchmarks for each Performance Measure. The table also provides the percentage values of the participant responses that are ‘Don’t know’, ‘Declined’, and ‘Missing’. These columns help to identify areas where data collection or entry issues may affect the overall outcome of a performance measure. Data can be downloaded by clicking on each performance measure in the table. | |
Participants Screened Overview | |
|---|---|
Participants Screened Dashboard provides summary information on the number of participants screened, filtered by grant recipient and participant type (Case Management/Care Coordination or Group-Based Health Education). If “Group-Based” is selected in the participant type filter, “# of Children Screened” will not display values as children are not considered Group-Based Health Education participants. This page has a header section composed of defined summary data displayed in 4 text areas and a body with 3 additional visualizations. | |
Participants Screened Dashboard Summary Cards | |
The summary cards highlight the number of Pregnant Women Screened, Non-Pregnant Women Screened, Children<18 months Screened and Fathers/Partners Screened.
| |
Participants Screened Dashboard Charts | |
Chart 1: # of Participants Screened by Recipient The # of Participants Screened by Recipient chart provides an overview of total number of participants screened by grant recipient for a selected screened period. Screened period is broken out into screened months. | |
Chart 2: # of Participants Screened by Race The # of Women Screened by Race donut chart provides an overview of total number of women (pregnant and non-pregnant) screened categorized by race for a selected screened period. Similarly, the # of Children Screened by Race chart provides insights into the racial distribution of children screened within the selected screened period. | |
Chart 3: # of Participants Screened by Ethnicity The # of Women Screened by Ethnicity donut chart provides an overview of total number of women (pregnant and non-pregnant) screened categorized by ethnicity for a selected screened period. Similarly, the # of Children Screened by ethnicity chart illustrates the ethnic breakdown of children screened within the selected screened period. | |
CM/CC Data Collection Detail Overview | |
|---|---|
The CM/CC Data Collection Detail dashboard provides information on the implementation of the Healthy Start Data Collection forms for Case Management/Care Coordination participants. It provides details on data collection status by participant, such as when the initial version of a form was completed, the number of form updates made, and the general status of the participant within the Healthy Start Program at the time of screening/re-screening. For additional details, click '?' icon. The dashboard has filters for the Month and Year of Enrollment Date. Participant Status:
'Archived' in the participant status column indicates that the record is archived because a form update occurred containing more recent data for the participant. ‘N/A’ indicates that the Participant Status cannot be defined as there have been no dates entered for the participant. "Archived" and "Latest" statuses may both appear for the same form in the updated form table. This indicates the form was updated without changes to the update type or date, causing both statuses to be recorded. The tables below will display blank (i.e., no information) if there is no data applicable to the corresponding filter(s) applied. | |
Data Collection Detail Tables | |
Initial Form Table: This table shows each participant, form type, their enrollment date and when they initially completed the form. The table calculates the status of the participant within the Healthy Start program based on the most recent information as determined by date. Finally, the table also gives the form status whether the record is archived or latest based on a form update containing more recent data for the participant | |
| Updated Form Table: This table shows each participant, form type, their enrollment date, the type of update they made to the form and the date they updated the form. The participants who exit from healthy start program will have exit date. The table also captures participant status and form status. | |
Participant Linkages Overview | |
|---|---|
The Participant Linkages dashboard displays the linkages between primary participants, and between primary participants and any enrolled children. Users can filter by category to view participants with linkages to other participants, participants with linkages to children and other participants. The purpose of this dashboard is to provide grantees the ability to view all PPUID and ECUID linkages, from parent to parent and parent to child, allowing grantees to identify all linkages and verify their accuracy. The Enrolled Child ID indicates linkage to the Primary Participant ID only, not to the Linked Primary Participant ID. If a Linked Primary Participant ID is blank, this indicates that the Primary Participant ID does not have any linkages to other participants. If an Enrolled Child ID is blank, this indicates that the Primary Participant ID does not have any linkages to children. The table below will display blank (i.e., no information) if there is no data applicable to the corresponding filter(s) applied. The table will show all PPUIDs that are linked to each other as well as all ECUIDs that they are linked to. | |
Participant Linkages Table | |
This table shows the participants, linked participants, and the enrolled children – all identified by PPUID and ECUID. This table also shows the Participant Types for the primary and linked participants. | |
Accessing the Dashboard in the EHBs | ||
|---|---|---|
| 1 | Login to the EHBs (https://grants.hrsa.gov) as a Grantee using Login.gov and two-factor authentication. For information about logging into the EHBs and Login.gov, refer to the EHBs Login Process help page. You will land on the EHBs Home page. | |
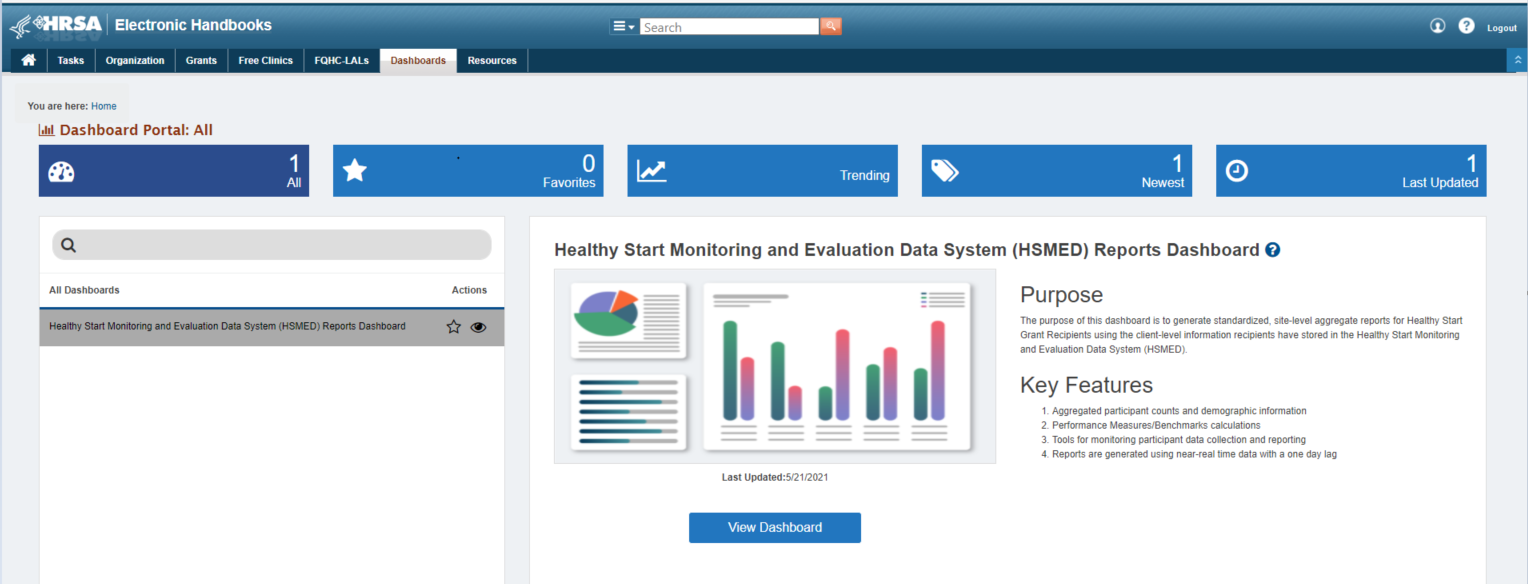
| 2 | Click Dashboards on the Top Menu. You will land on the Dashboards list page, listing all the available dashboards for your role. Select Healthy Start Monitoring and Evaluation Data System (HSMED) Reports Dashboard from the list -side menu. | |
| 3 | Click on the View Dashboard link. | |
Downloading as Data, Crosstab, and PDF | ||
|---|---|---|
| 1. | Download as “Data” format – CM/CC Data Collection Detail Tab. By default, the “Data” and “Crosstab” options will not be activated. | |
| 2. | To download the tabular format, click on the table graph on the dashboard. In this example, Form Update Date was selected. The “Data” and” Crosstab” options are now activated. | |
| 3. | Similarly, if “Data” from the download options is selected, the data view is displayed and can be downloaded as a text file. | |
| 4. | The downloaded excel file will show data as: | |
| 5. | Download “Crosstab” – CM/CC Data Collection Detail Tab. If a cell is selected as in step #2, and then unselected, the highlighted color will disappear. Click on the download link and the options show as: | |
| 6. | Click on “Crosstab” and the data will be downloaded as an Excel file and shown as: | |
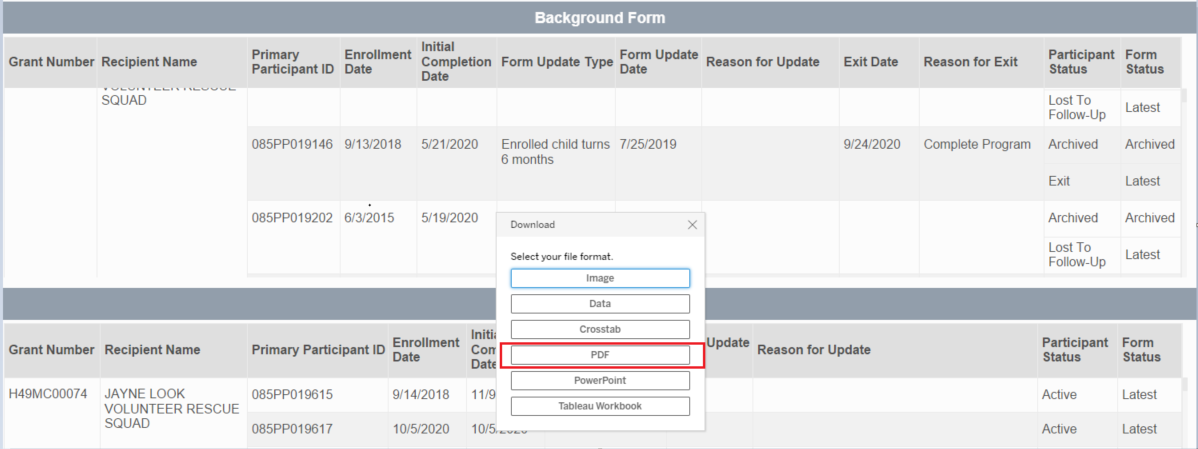
| 7. | Downloading a Dashboard as a PDF -CM/CC Data Collection Detail Tab. To download a dashboard as a PDF, click on the download link and select “PDF” as shown. | |
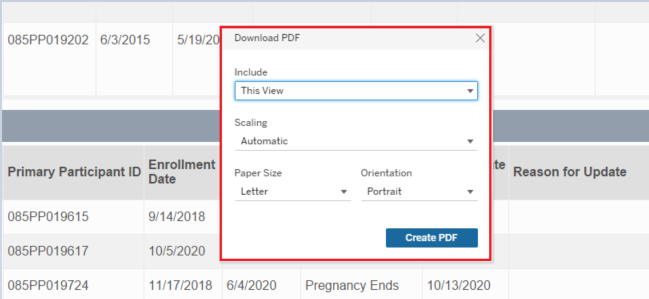
| 8. | After clicking "PDF" the download PDF window will be displayed. Select "This View" and click on "Create PDF." | |
| 9. | A PDF will be generated and downloaded. | |


